With active addresses on a steady ascent and its correlation with Ethereum painting a bullish picture, MATIC’s value proposition is gaining traction. Does this mark the beginning of a price rally, and if so, could we see it ascend to the $1.24 threshold?
This analysis delves into the metrics forecasting MATIC’s potential trajectory, harnessing data to unravel the narrative.
Active Addresses on the Rise
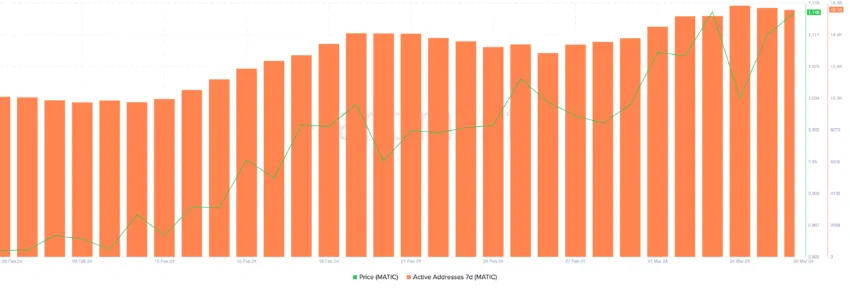
Active MATIC addresses grew by almost 60% in the last 30 days. Historically, we can see a strong correlation between growth in active addresses and price, as seen in the chart below.
On February 6, it registered 10,439 active addresses. That number jumped to 15,708 on March 3. The price followed that lead, growing from $0.83 to $1.14 in the same period — a 37.35% growth.
Matic hasn’t touched the $1.14 price level since April 2023.

Despite the notable growth in active addresses and the price over the last month, things have started to plateau. Based on historical data, a halt in the growth of active addresses often precedes a period of price stabilization or a potential price correction.
This pattern suggests that we might expect the price of MATIC to follow suit, potentially entering a consolidation phase or experiencing a downward adjustment in the near future.
Correlation With Ethereum: A Bullish Harmony
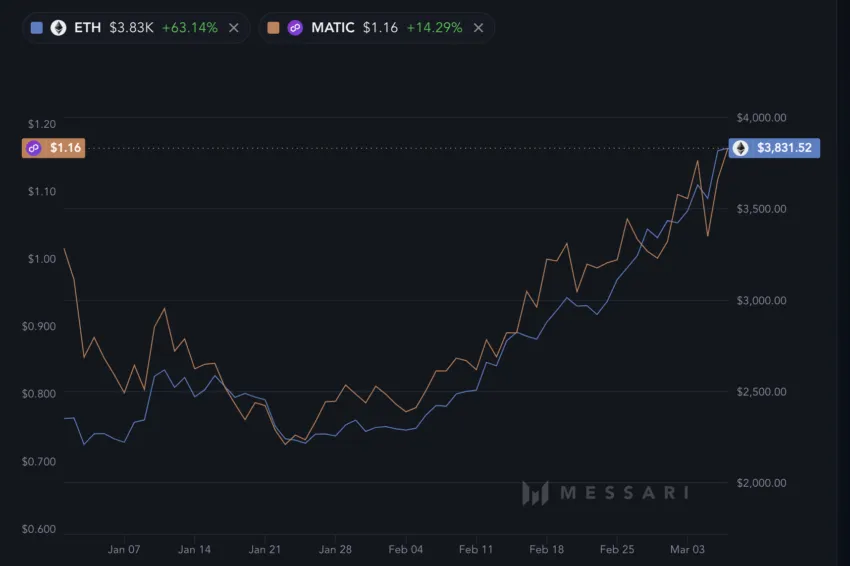
Historically, MATIC prices have closely mirrored those of ETH, typically showing a correlation coefficient exceeding 0.8. This connection intensified notably last month. Specifically, the correlation soared from a modest 0.5 on February 1 to a striking 0.95 by March 6.
Given the current upward momentum of Ethereum, this close correlation might signal promising prospects for MATIC. It may even guide MATIC towards the $1.24 price target forecasted above.

On the other hand, a distinct disparity becomes evident when examining the growth rates of both ETH and MATIC throughout the current year. The ETH price has escalated by a factor of 4.5 times more than MATIC. With the backdrop of their traditionally robust correlation, it seems plausible to predict that MATIC could have the potential for an upswing.

Further analysis reveals that when MATIC growth for the year-to-date is placed against that of the top 10 largest cryptocurrencies excluding memecoins and stablecoins, it lags behind. MATIC was outpaced by nine of these major cryptos, only managing to achieve a higher growth rate than AVAX.
MATIC Price Prediction: Is $1.23 Possible By March 15?
Analyzing the IOMAP chart shows that the large number of addresses “In the Money” suggests that there is significant support at lower price levels, specifically around the large concentration of buyers at $1.10. If this level holds, it could prevent further downtrends.
If the price breaks above the $1.17 resistance, it could indicate a strong bullish signal and potentially lead to a further upward move toward the next resistance levels around $1.21 and potentially $1.24 or higher. This is because the red bubbles (indicating addresses “Out of the Money”) beyond $1.14 would start to turn green (profitable), thus reducing selling pressure.

If the current support levels are broken, especially if the price drops below the large green bubble between $1.10 and $1.14, it could trigger a bearish trend. This is because breaking a significant support level might lead to a loss of confidence and potentially cause a sell-off.
Also, the correlation with ETH can decrease. Even if it continues to have a high correlation, MATIC’s price could suffer if ETH enters a bearish trend.


