Crypto Market Sentiment Research Report (2024.05.03–05.10): US non-farm data far from expectations, Bitcoin rebounded fr
US non-farm data far below expectations, Bitcoin rebounds after new low
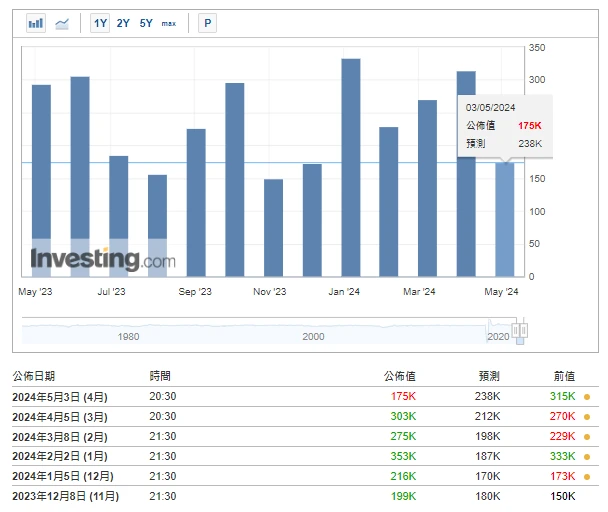
Data source: https://hk.investing.com/economic-calendar/nonfarm-payrolls-227
The increase in non-farm payrolls in the United States in April was significantly lower than expected, the smallest increase in six months, and the unemployment rate unexpectedly rose to 3.9%. The year-on-year wage increase was 3.9%, lower than expected and the previous value, which is conducive to cooling inflation. After the data was released, traders expected the first interest rate cut by the Federal Reserve to be brought forward from November to September. After the data was released, Bitcoin rebounded from a low of $59,000 to a high of $65,500 in a short period of time.
There are about 34 days until the next Fed meeting (June 13, 2024)
https://hk.investing.com/economic-calendar/interest-rate-decision-168
Market technical and sentiment environment analysis

Sentiment Analysis Components
Technical indicators
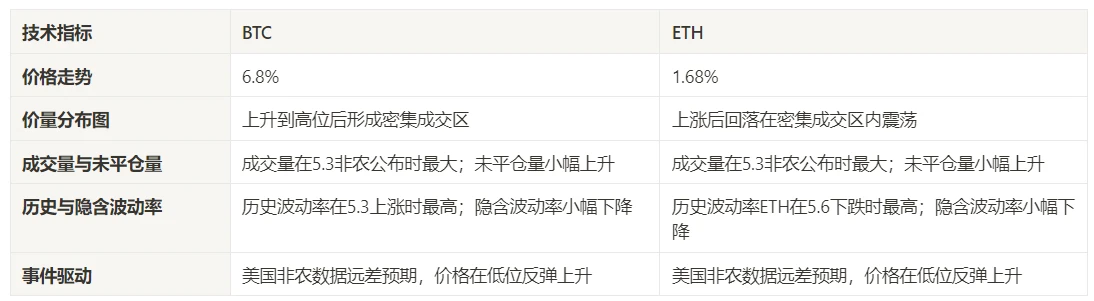
Price trend
BTC prices rose 6.8% and ETH prices rose 1.68% over the past week.
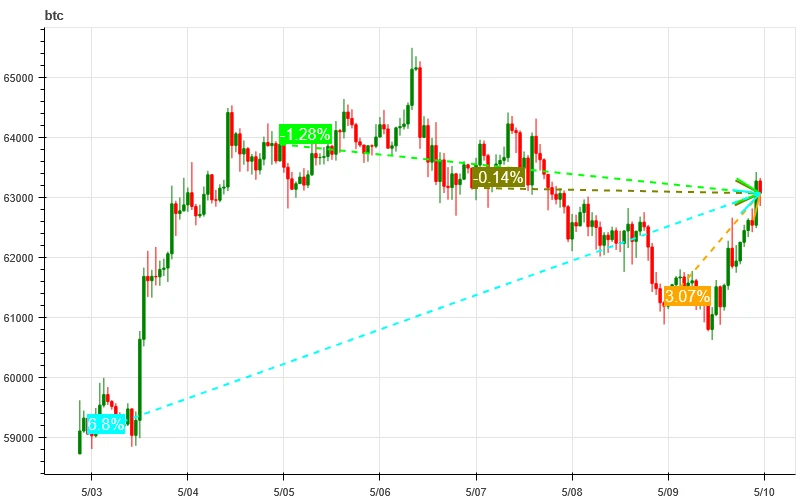
The above picture is the price chart of BTC in the past week.

The above picture is the price chart of ETH in the past week.

The table shows the price change rate over the past week.
Price Volume Distribution Chart (Support and Resistance)
In the past week, BTC rose and formed a dense trading area, while the price of ETH fluctuated within the dense trading area.
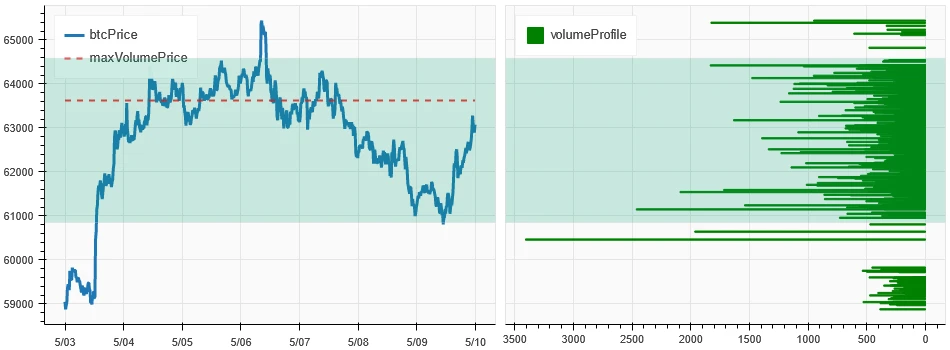
The above picture shows the distribution of BTCs dense trading areas in the past week.

The above picture shows the distribution of ETHs dense trading areas in the past week.

The table shows the weekly intensive trading range of BTC and ETH in the past week.
Volume and Open Interest
In the past week, the trading volume of BTC and ETH was the largest when the non-farm data was released on May 3; the open interest of BTC and ETH both increased slightly.

The top of the above picture shows the price trend of BTC, the middle shows the trading volume, the bottom shows the open interest, the light blue is the 1-day average, and the orange is the 7-day average. The color of the K-line represents the current state, green means the price rise is supported by the trading volume, red means closing positions, yellow means slowly accumulating positions, and black means crowded state.

The top of the above picture shows the price trend of ETH, the middle is the trading volume, the bottom is the open interest, the light blue is the 1-day average, and the orange is the 7-day average. The color of the K-line represents the current state, green means the price rise is supported by the trading volume, red is closing positions, yellow is slowly accumulating positions, and black is crowded.
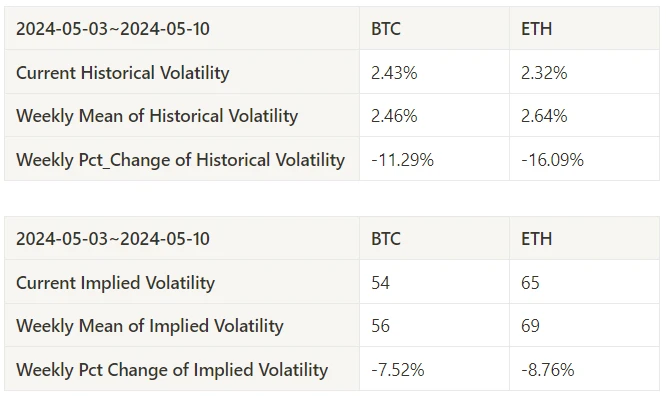
Historical Volatility vs. Implied Volatility
In the past week, the historical volatility was highest when BTC rose at 5.3 and highest when ETH fell at 5.6; the implied volatility of BTC and ETH both fell.

The yellow line is the historical volatility, the blue line is the implied volatility, and the red dot is its 7-day average.
Event-driven
In terms of events, the US non-farm data was far below expectations. After the data was released, both Bitcoin and Ethereum quickly rebounded from lows.
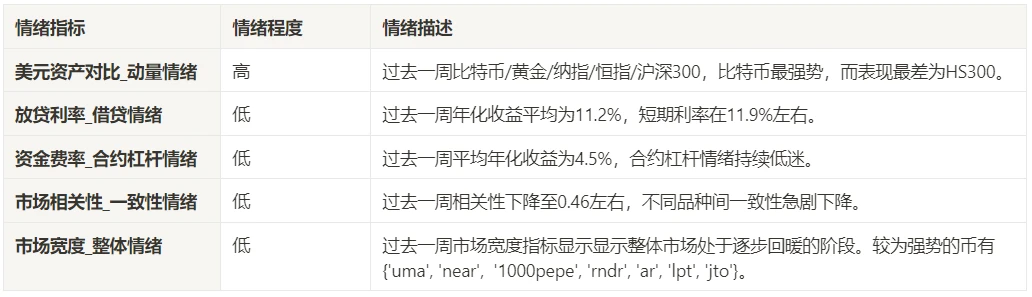
Sentiment Indicators
Momentum Sentiment
In the past week, among Bitcoin/Gold/Nasdaq/Hang Seng Index/SSE 300, Bitcoin was the strongest, while HS 300 performed the worst.
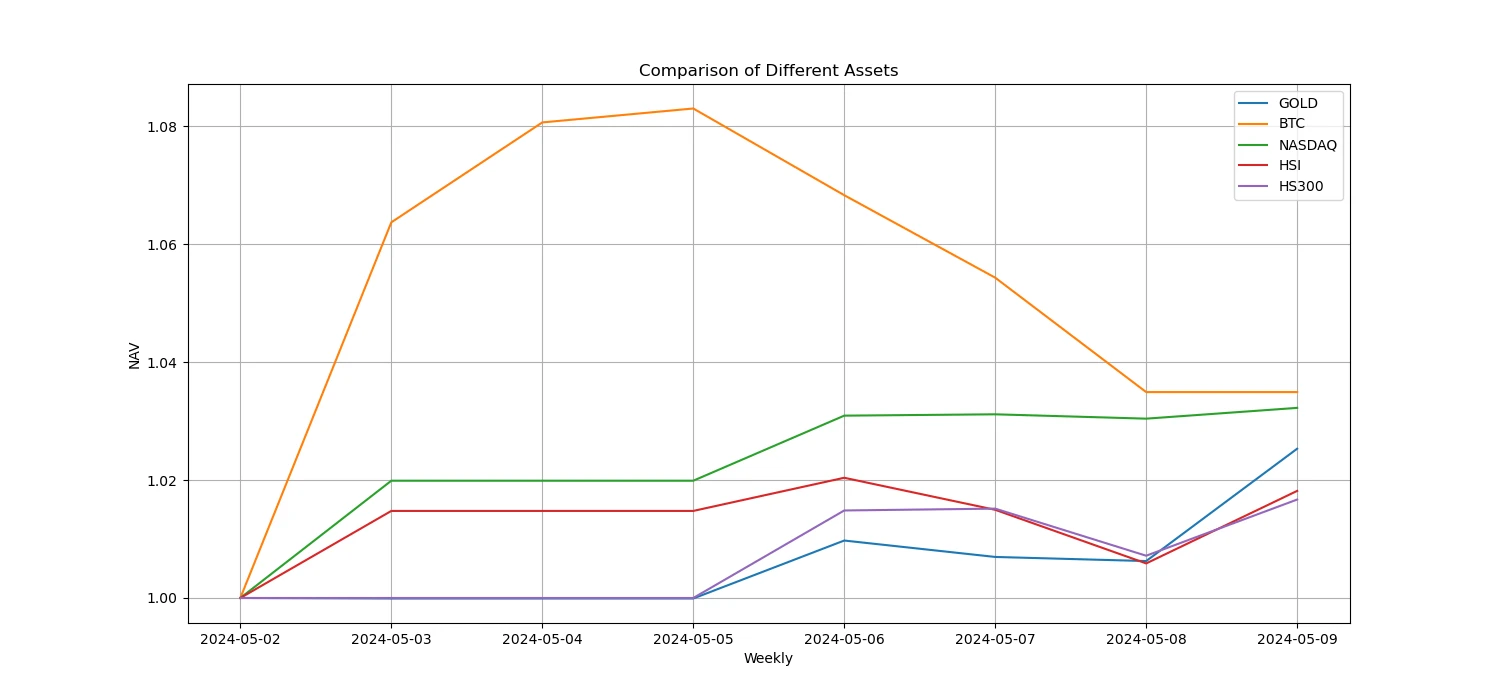
The above picture shows the trend of different assets in the past week.

Lending Rate_Lending Sentiment
The average annualized return on USD lending in the past week was 11.1%, and the short-term interest rate was around 11.9%.
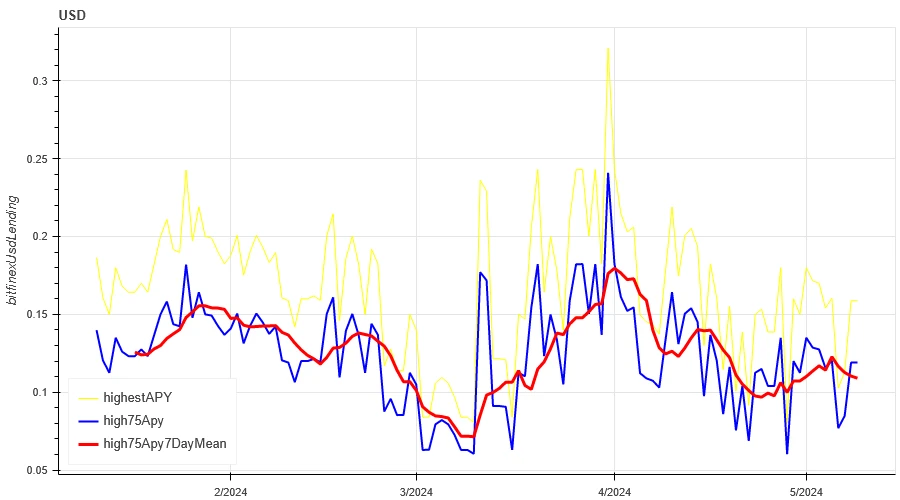
The yellow line is the highest price of USD interest rate, the blue line is 75% of the highest price, and the red line is the 7-day average of 75% of the highest price.
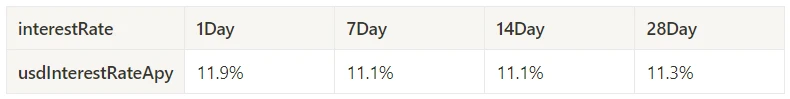
The table shows the average returns of USD interest rates at different holding days in the past
Funding Rate_Contract Leverage Sentiment
The average annualized return on BTC fees in the past week was 4.5%, and contract leverage sentiment continued to be sluggish.
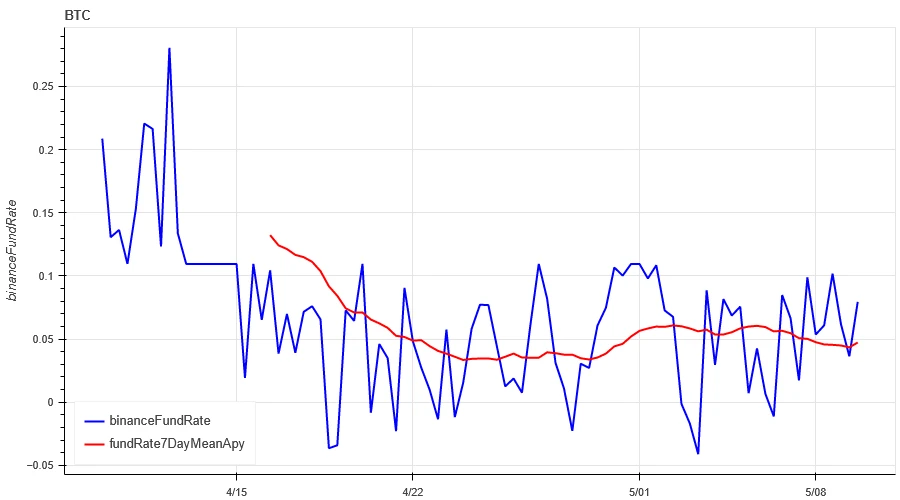
The blue line is the funding rate of BTC on Binance, and the red line is its 7-day average
The table shows the average return of BTC fees for different holding days in the past.
Market Correlation_Consensus Sentiment
The correlation among the 129 coins selected in the past week dropped to around 0.46, and the consistency between different varieties dropped sharply.

In the above figure, the blue line is the price of Bitcoin, and the green line is [1000 floki, 1000 lunc, 1000 pepe, 1000 shib, 100 0x ec, 1inch, aave, ada, agix, algo, ankr, ant, ape, apt, arb, ar, astr, atom, audio, avax, axs, bal, band, bat, bch, bigtime, blur, bnb, btc, celo, cfx, chz, ckb, comp, crv, cvx, cyber, dash, doge, dot, dydx, egld, enj, ens, eos,etc, eth, fet, fil, flow, ftm, fxs, gala, gmt, gmx, grt, hbar, hot, icp, icx, imx, inj, iost, iotx, jasmy, kava, klay, ksm, ldo, link, loom, lpt, lqty, lrc, ltc, luna 2, magic, mana, matic, meme, mina, mkr, near, neo, ocean, one, ont, op, pendle, qnt, qtum, rndr, rose, rune, rvn, sand, sei, sfp, skl, snx, sol, ssv, stg, storj, stx, sui, sushi, sxp, theta, tia, trx, t, uma, uni, vet, waves, wld, woo, xem, xlm, xmr, xrp, xtz, yfi, zec, zen, zil, zrx] overall correlation
Market Breadth_Overall Sentiment
Among the 129 coins selected in the past week, 44% of the prices were above the 30-day moving average, 47% of the prices were above the 30-day moving average relative to BTC, 11% of the prices were greater than 20% from the lowest price in the past 30 days, and 7% of the prices were less than 10% from the highest price in the past 30 days. The market breadth indicators in the past week showed that the overall market was in a stage of gradual recovery.

The above picture is [1000 floki, 1000 lunc, 1000 pepe, 1000 shib, 100 0x ec, 1inch, aave, ada, agix, algo, ankr, ant, ape, apt, arb, ar, astr, atom, audio, avax, axs, bal, band, bat, bch, bigtime, blur, bnb, btc, celo, cfx, chz, ckb, comp, crv, cvx, cyber, dash, doge, dot, dydx, egld, enj, ens, eos,etc, eth, fet, fil, flow, ftm, fxs, gala, gmt, gmx, grt, hbar, hot, icp, icx, imx, inj, iost, iotx, jasmy, kava, klay, ksm, ldo, link, loom, lpt, lqty, lrc, ltc, luna 2, magic, mana, matic, meme, mina, mkr, near, neo, ocean, one, ont, op, pendle, qnt, qtum, rndr, rose, rune, rvn, sand, sei, sfp, skl, snx, sol, ssv, stg, storj, stx, sui, sushi, sxp, theta, tia, trx, t, uma, uni, vet, waves, wld, woo, xem, xlm, xmr, xrp, xtz, yfi, zec, zen, zil, zrx] 30-day proportion of each width indicator

Summarize
In the past week, the prices of Bitcoin (BTC) and Ethereum (ETH) rose after the release of non-farm data, but then Ethereum fell back sharply. The historical volatility reached its maximum when Bitcoin rose to 5.3, while Ethereum reached its maximum when it fell back to 5.6. The trading volume reached its maximum after the release of non-farm data, and the open interest increased slightly. The implied volatility was declining overall. The funding rate remained low, and the market breadth indicator showed that the market was gradually recovering. In terms of events, the US non-farm data was far below expectations, and Bitcoin and Ethereum quickly rebounded from lows after the data was released.
Twitter: @DerivativesCN
Website: https://dcbot.ai/
Medium: https://medium.com/@DerivativesCN
This article is sourced from the internet: Crypto Market Sentiment Research Report (2024.05.03–05.10): US non-farm data far from expectations, Bitcoin rebounded from lows
Related: Avalanche (AVAX) Price Prediction: Can It Reach $70?
In Brief Avalanche (AVAX) price has risen by 21.93% in the last 7 days. Despite its recent surge, RSI is still healthy, which could indicate more growth is coming. The number of profitable holders is currently sitting at 75%. Historical data suggests this is a tipping point for AVAX. Over the past week, Avalanche (AVAX) price has experienced a significant increase, accumulating a 21.93% growth. Despite its recent surge in value, the Relative Strength Index (RSI) remains healthy, suggesting that AVAX might grow further. Currently, 75% of AVAX holders are in a profitable position. Historical data shows that this level often serves as a critical tipping point for AVAX, indicating that the asset could be at a pivotal moment for future performance. AVAX RSI Is Close to 70, but It’s…


