
The LINK price on the 4-hour chart has recently showcased a golden cross, indicating a bullish turn that could propel its value higher. This development aligns with the MVRV ratio, pointing out that LINK is in an advantageous position for accumulation.
Furthermore, a significant portion of active Chainlink (LINK) addresses are held by investors who are either profiting or, at the very least, breaking even. This factor is crucial as it underpins the ongoing consolidation, suggesting that the LINK price may continue to stabilize or climb as the market responds positively to these indicators.
Profitable and Break-Even Holders Represent Good Support
Over the past week, the price of LINK has experienced a notable increase of 17.97%, prompting questions about the sustainability of this upward trend.
Currently, 35% of active LINK addresses are in a profitable position, with an additional 60% sitting at the break-even point. This effectively means that approximately 95% of LINK holders are not facing any losses from their current holdings, creating a robust foundation for market confidence.
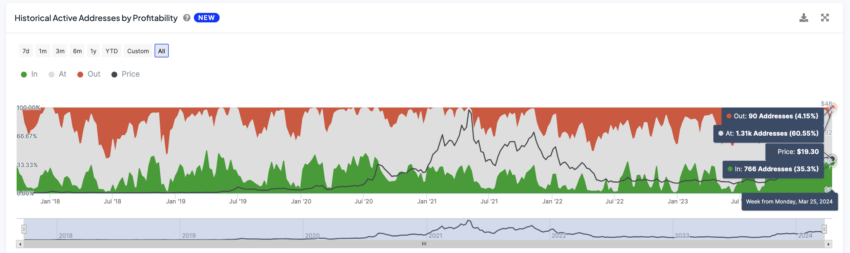
This absence of losses among the vast majority of LINK’s active investor base suggests a strong inclination towards retaining their investments. Such an approach to hold rather than sell contributes significantly to stabilizing LINK’s price. This would happen by preventing mass sell-offs during market fluctuations.
This situation offers substantial support to LINK’s price, potentially cushioning it against sharp declines. This can also foster an environment where the recent uptrend could be sustained over the next weeks.
Read More: Chainlink (LINK) Price Prediction 2024/2025/2030
Chainlink MVRV Shows a Good Scenario For Accumulation
The Market Value to Realized Value (MVRV) ratio for LINK is currently hinting at bullish prospects. This ratio, which gauges the profit or loss status of investors, shows that with a 30-day MVRV sitting at 2.73%.
The MVRV Ratio for 30 days is a metric used to gauge the average profit or loss of investors. It’s calculated by dividing the Market Value (the current price times the total supply) by the Realized Value (the value of all coins at the price they were bought in the last 30 days), and then expressing this ratio as a percentage.
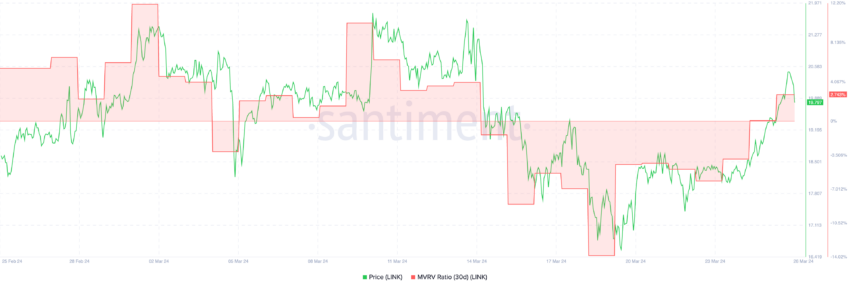
A positive 30D MVRV ratio means recent investors are profiting, possibly leading to sales as they cash in. In contrast, a negative ratio indicates recent losses. This metric is key for spotting short-term market trends and buying patterns.
In the past, when LINK’s 30D MVRV hovered around 2.7%, it often preceded buying sprees and subsequent price increases. Currently, the MVRV ratio’s level makes Chainlink a compelling choice for investment, likely attracting more buyers.
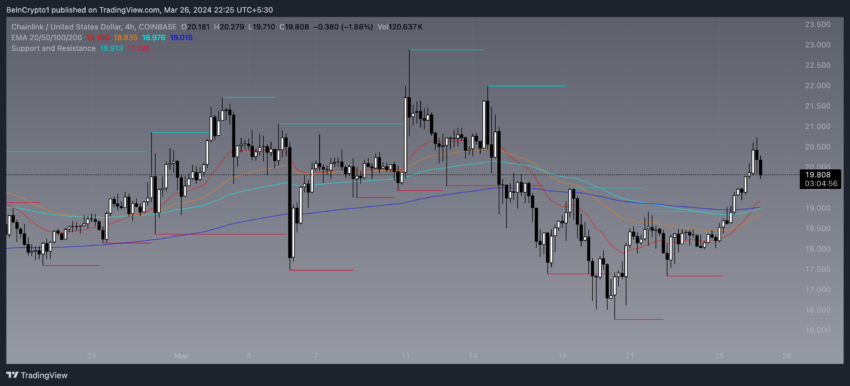
LINK Price Prediction: Chainlink Just Formed A Golden Cross
The 4-hour price chart for Chainlink (LINK) has just displayed a significant technical indicator, as its Exponential Moving Average (EMA) lines have formed a golden cross.
This phenomenon occurs when a shorter-term EMA, typically the 50-period line, crosses above a longer-term EMA, such as the 200-period line, signifying a potential shift from a bearish to a bullish market trend. Currently, the price of LINK is trading above all of its EMA lines, indicating strong upward momentum and confirming the bullish signal provided by the golden cross.
EMA lines represent averages of prices, adjusted to focus more on recent data. They filter market noise, making trends clearer. By weighing recent prices heavier, they react faster to price changes than simple moving averages.
Read More: How To Buy Chainlink (LINK) and Everything You Need To Know
This makes EMAs crucial for traders looking to gauge short-term momentum. If LINK’s upward trend holds, it might overcome the $26 resistance, aiming for $30 – a level not seen since November 2021. However, if the support isn’t enough, LINK could fall back to $16.


