
Over the past week, Avalanche (AVAX) price has experienced a significant increase, accumulating a 21.93% growth. Despite its recent surge in value, the Relative Strength Index (RSI) remains healthy, suggesting that AVAX might grow further.
Currently, 75% of AVAX holders are in a profitable position. Historical data shows that this level often serves as a critical tipping point for AVAX, indicating that the asset could be at a pivotal moment for future performance.
AVAX RSI Is Close to 70, but It’s Still Healthy
Over the past few days, there has been a noticeable decrease in the 7-day Relative Strength Index (RSI) for AVAX, dropping from 75 to 69. Despite this decline, its price astonishingly surged from $40 to $61 within the span of a week.
The RSI is a momentum oscillator to evaluate the velocity and magnitude of directional price movements. It operates on a scale ranging from 0 to 100, where an RSI figure above 70 typically signals an overbought condition, indicating that the asset might be priced higher than its actual value, and a reading below 30 suggests an oversold state, hinting that the asset could be undervalued.
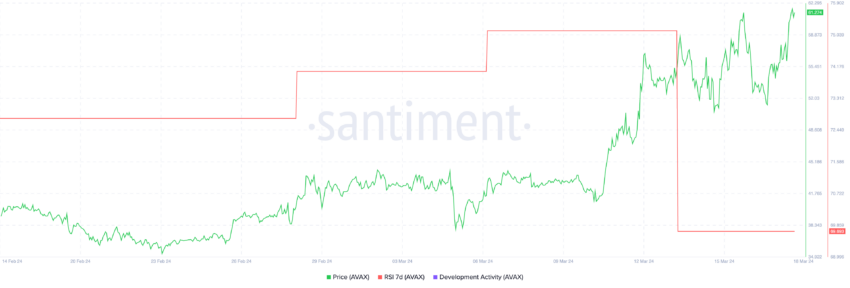
The observed decrease in the RSI, in tandem with a remarkable uptick in price, implies that although there’s a slight decline in the buying momentum for AVAX, its market price has managed to climb higher. This scenario could be attributed to robust investor confidence or recognizing intrinsic value within AVAX.
With the RSI hovering around 69, it verges on the brink of entering the overbought zone. Still, it remains within what can be considered a relatively healthy range, indicating neither overvaluation nor undervaluation in a significant manner.
Should the RSI maintain its position below the overbought mark without experiencing a steep decline, this might further indicate a continued interest from investors, thereby providing a foundation for additional upward movement in price. This scenario suggests that investors are still keen on supporting AVAX, potentially leading to sustained price appreciation.
75% of AVAX Holders Are Now Profitable
Following the recent upswing in its market value, an impressive 75% of AVAX holders, amounting to 5.6 million individuals, find themselves in a profitable position. This marks a significant shift from the stability observed over the previous two months, where the percentage of profitable AVAX holders oscillated between 50% and 60%.
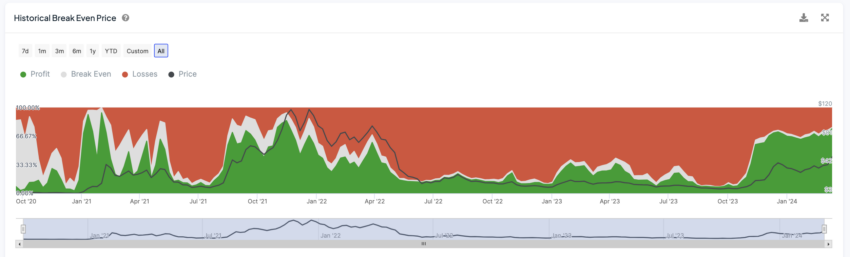
A similar surge to 75% profitable holders was last witnessed in 2021. After that surge, AVAX price experienced a substantial rise from $75 to $117 within just 20 days. This historical context illuminates the importance of the Historical Break Even Price as a metric.
Essentially, this metric gauges the average price at which all current holders would neither gain nor lose money, offering insights into the overall profitability of an investment in the cryptocurrency market over time.
For AVAX, 23% of holders are still at a loss, which could indicate that these holders will continue holding their AVAX, expecting it to rise more so they can become profitable. This is even more important since AVAX is still 57.91% below its all-time high, which reinforces the possible scenario where holders will not start selling their AVAX soon.
AVAX Price Prediction: Journey to $70 Again?
If the uptrend continues, we could witness an ascent to the $70 mark. That would be the first time since 2022 AVAX has reached that price. A noteworthy increase of 16.67% from its current price. To be able to do that, AVAX would need to break key resistances at $63, $65, and $67. However, they don’t seem that strong compared with AVAX support zones.
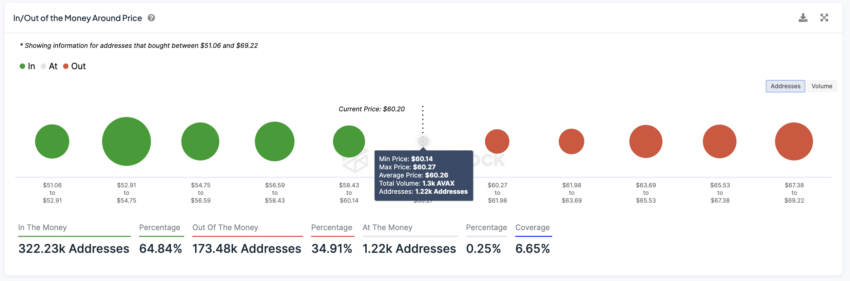
The chart in focus, an In/Out of the Money Around Price (IOMAP), visually represents where price levels align with clusters of investor activity. It provides a heatmap for areas with large numbers of “In the Money” addresses, potentially acting as support zones, and areas of “Out of the Money” addresses, suggesting potential resistance zones.
In the Money addresses are those who purchased AVAX at a price lower than the current price, implying they are currently in a profitable position. Out-of-the-Money addresses bought at higher prices and are presently at a loss.
On the other hand, AVAX has key support at $58 and $56. These levels represent key thresholds where the asset has previously found a strong buying interest, acting as a safety net against further declines. If AVAX cannot hold these critical support levels, it may succumb to bearish pressures, retreating towards the $52 level.
Such a decrease would signify a 13.33% reduction from its current price, underscoring the importance of these support zones in averting a more substantial drop in value.


