
Toncoin (TON) price is coming down from the correction scare and is likely set to initiate recovery soon.
This is possible if TON holders make the best of this opportunity and attempt to add more TON to their wallets.
Toncoin Could Witness Recovery
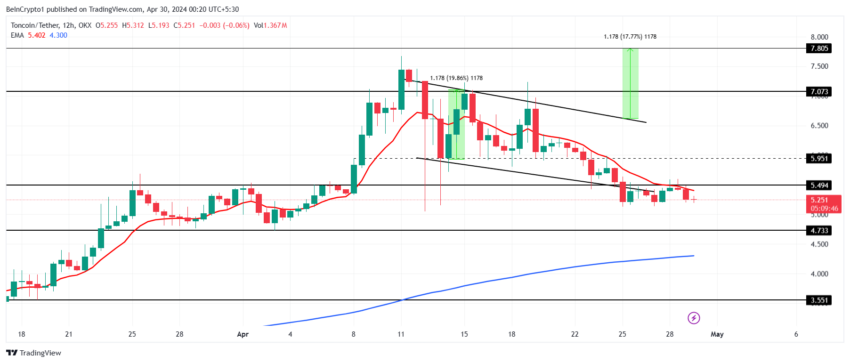
Toncoin’s price was expected to note a rally last week, but after falling out of the descending channel, the price changed. TON fell but kept itself afloat at around $5.2 and $5.4, which marks the resistance level.
This could very possibly be changed by the investors if they opt to add more TON to their holdings. According to the Market Value to Realized Ratio (MVRV) ratio, the altcoin is heating up owing to the recent incident.
The MVRV ratio monitors investor profits and losses. With Toncoin’s 30-day MVRV at -13.22%, indicating losses, recovery may ensue. Historically, when TON undergoes a -10% to -20% MVRV zone, it is known as an accumulation opportunity zone.
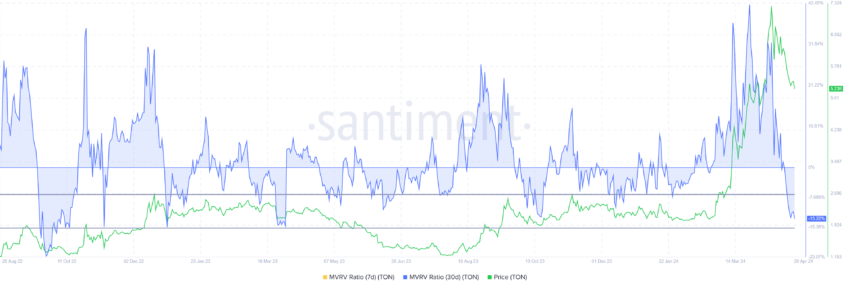
Accumulation would lead to a surge in demand, which would inherently result in a surge in price.
Read More: What Are Telegram Bot Coins?
The potentially rising interest is also evinced from the shift in tone of the market towards TON. The Moving Average Convergence Divergence (MACD) is at the cusp of registering a bullish crossover. MACD is a trend-following momentum indicator that shows the relationship between two moving averages of a security’s price.
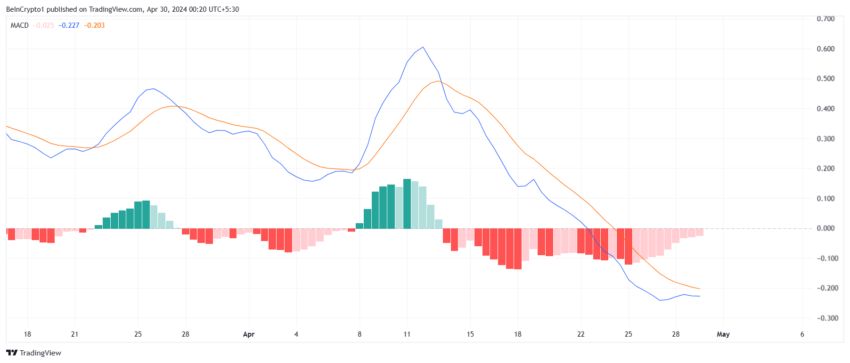
According to this indicator, the potential bullish crossover is a signal that the market is noting value in the asset. A crossover would confirm this as the price would begin to recover and rally.
TON Price Prediction: What After the Support?
Toncoin’s price trading at $5.2 is just under the resistance of $5.4, and breaching it would confirm a potential bullish outcome. This is because $5.4 has been tested as a crucial resistance multiple times in the past.
In the last few days, TON did not manage to breach this barrier, but it also prevented a decline. This resilience could be rewarded by investor support, which could potentially push Toncoin’s price up to $6.
Read More: Which Are the Best Altcoins To Invest in April 2024?
However, on the off chance that a breach fails and TON ends up correcting, it could test the $4.7 level as support. This crucial support has been tested in the past, and losing it would invalidate the bullish thesis and extend TON holders’ losses.


