
What’s next for Ripple (XRP) Price? A significant decline in XRP development activity has been observed, with a tenfold decrease over ten days. This raises concerns regarding ongoing interest and innovation within the XRP ecosystem. Furthermore, daily active addresses associated with XRP have fallen by 20% in the past week.
This reduction in user engagement could potentially exert downward pressure on the XRP price. Finally, technical analysis based on Exponential Moving Averages (EMA) charts suggests the formation of a bearish signal.
Development Activity Is Declining Heavily
Traditionally, a robust development ecosystem strongly correlates with a cryptocurrency’s price. This holds true for XRP as well. On March 13, XRP’s development activity reached its highest level since November 2023, clocking in at 13.18. This surge in activity could be interpreted as a surge in investor interest and confidence in the project’s future.
However, a concerning trend emerged shortly thereafter. Development activity steadily declined, reaching its lowest point in two weeks. This could potentially signal a shift in developer focus or a slowdown in innovation within the XRP ecosystem.
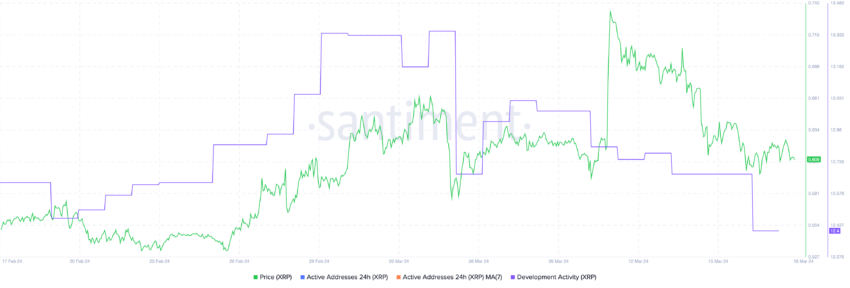
Considering this decline in the context of XRP’s recent price action is important. Between February 23 and March 11, XRP price significantly surged, climbing from $0.53 to $0.73 – a remarkable 37% increase in less than three weeks. This rapid price appreciation might have triggered profit-taking from investors who capitalized on the market momentum.
This selling pressure could explain the subsequent price correction, with XRP dropping from $0.73 to $0.60 within a week. The timing of the decline in development activity coinciding with the price correction raises questions about the potential interplay between these two factors.
XRP Active Addresses Are Also Declining
XRP Daily Active Addresses experienced a brief surge, rising 11% between March 7 and 9 to reach over 34,000 addresses. Historically, a strong correlation has existed between Daily Active Addresses and XRP’s price. However, a concerning divergence emerged in recent months.
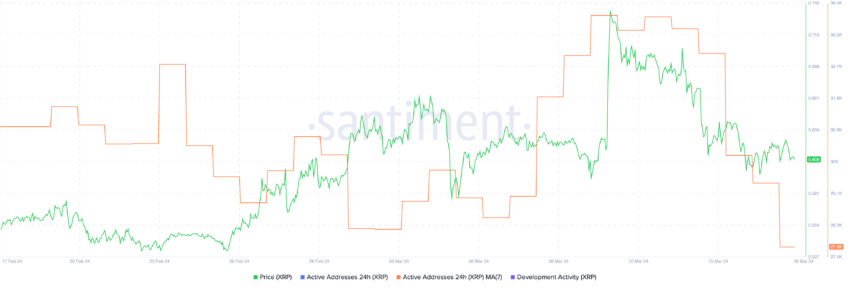
Despite a stagnant or even declining number of Daily Active Addresses, XRP price climbed alongside the broader market rally fueled by Bitcoin (BTC) and Ethereum (ETH). This detachment from its usual correlated behavior warrants close attention.
The recent five-day decline in Daily Active Addresses is particularly concerning, as it potentially signals a renewed coupling with price movements. If this correlation holds true, the falling number of active addresses could foreshadow a price correction for XRP.
XRP Price Prediction: The Chart Just Raised A Red Flag
A watchful eye must be cast on the XRP 4-hour price chart, which currently hints at a potential floor of around $0.58. If this critical support crumbles, XRP could witness a deeper correction, plunging to $0.51, a 15% drop.
Further fueling bearish anxieties is the Exponential Moving Averages (EMAs) on the XRP chart. EMAs function as technical tools that help identify trends by smoothing out price data and placing more emphasis on recent price points. This responsiveness makes them superior to Simple Moving Averages (SMAs) in capturing short-term price movements.
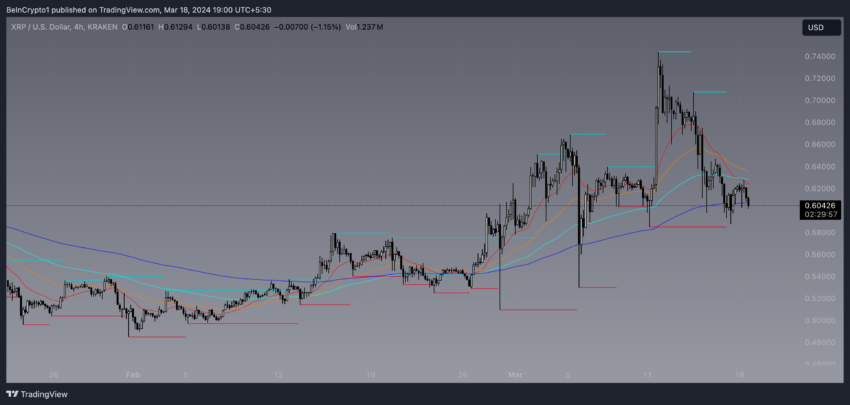
A worrying development on the chart is the emergence of a “Death Cross.” This ominous pattern forms when a shorter-term EMA dips below a longer-term EMA. This scenario suggests a potential shift in market sentiment from optimistic to pessimistic.
When shorter-term EMAs (like the EMA 20) fall beneath longer-term EMAs (like the EMA 100 or 200), it indicates that recent prices are lower than historical ones, potentially signaling that sellers are taking control and a downward spiral might be imminent.
However, if XRP can defy the odds and reverse this trend despite dwindling active addresses and development activity, it could attempt to challenge the resistance level at $0.64. A successful breach of this resistance could pave the way for a climb to $0.75.


