
In a spectacular display of bullish momentum, Celestia (TIA) has catapulted to a new all-time high, touching $20.60.
This remarkable surge emerged following a breakout from an ascending triangle formation on the 4-hour charts, recorded on February 7. Since then, TIA’s value has soared, marking an impressive 11.74% increase.
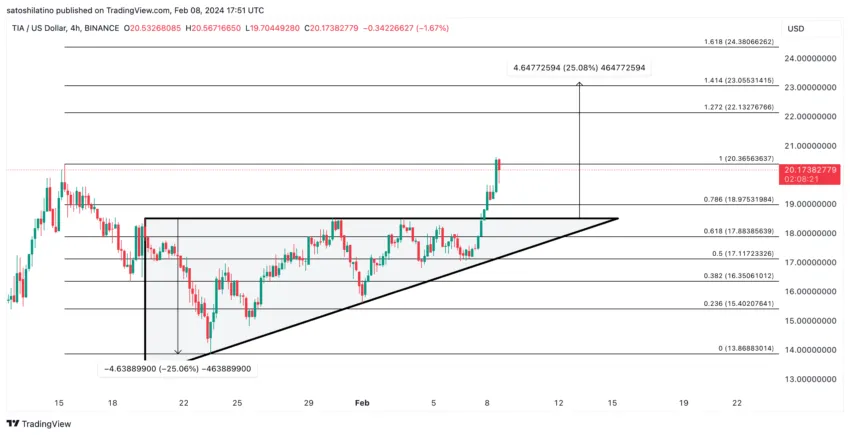
Celestia (TIA) Reaches New All-Time High
The digital currency’s trajectory suggests a robust upward momentum fueled by technical patterns and market optimism. An analysis of TIA reveals an ascending triangle pattern, a reliable indicator of future price movements. It projects an additional 12.46% increase in TIA’s value.
This projection potentially positions Celestia to cross the $23 mark in the near term.
Investors and market watchers are now speculating on the possibility of TIA reaching the $30 milestone. Given its current performance and the technical outlook, such an achievement seems increasingly plausible. Celestia’s journey to this new peak is a testament to its growing appeal among investors seeking promising opportunities in the crypto space.
This is a developing story…

PrimeXTB
Explore →


