
The Litecoin (LTC) price currently displays bullish signals against Bitcoin, prompting speculation about a potential significant upward movement for LTC.
However, despite these promising indicators, the initial trends observed this month have leaned towards bearishness. As such, while the possibility of a sharp increase in the LTC price looms should the bullish signals intensify, the current market conditions suggest a cautious approach.
Litecoin’s Rough Month: Down 37.3% Amid Market Turbulence
The Litecoin price has experienced a notable decline of over 37.3% this month, following a local peak of around $113. LTC is hovering around the golden ratio support level at approximately $80, offering a potential opportunity for a bullish rebound.
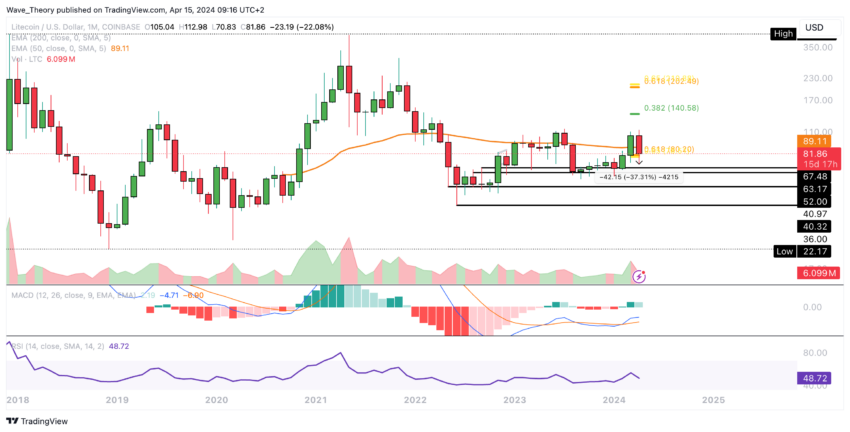
Additionally, the Moving Average Convergence Divergence (MACD) lines have formed a bullish crossover on the monthly chart. However, the MACD histogram is beginning to trend lower bearishly, while the Relative Strength Index (RSI) is situated in neutral territory.
Read More: How To Buy Litecoin (LTC) and Everything You Need To Know
Weekly Chart Analysis: The Golden Ratio as a Strong Support Level
Last week, the LTC price initially dipped below the Golden Ratio support level of around $80. However, the price had precisely returned to this critical support level by the week’s close.
This suggests a potential for an upward movement in the current week. Nevertheless, the MACD histogram on the weekly chart indicates bearish signals since the previous week.
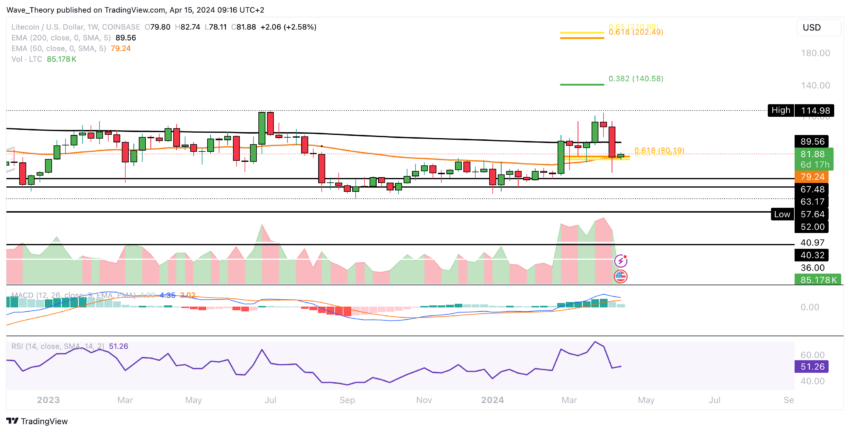
This implies a possible bearish crossover of the MACD lines in the near future. Moreover, the Exponential Moving Averages (EMAs) exhibit a death cross pattern on the weekly chart, indicating a bearish trend in the medium term.
Meanwhile, the RSI remains neutral territory, offering no clear indications of bullish or bearish momentum.
Litecoin’s Positive Signal: Golden Crossover Remains in Daily Chart
In Litecoin’s daily chart, a golden crossover persists, indicating a sustained bullish trend in the short to medium term. However, there has been a recent bearish crossover of the MACD lines.
Simultaneously, the MACD histogram shows bullish momentum today, while the RSI remains neutral. Two key hurdles lie ahead for LTC’s trajectory.
The first resistance sits around $89.4, coinciding with the 50-day EMA. Additionally, significant Fibonacci resistance looms around $97.
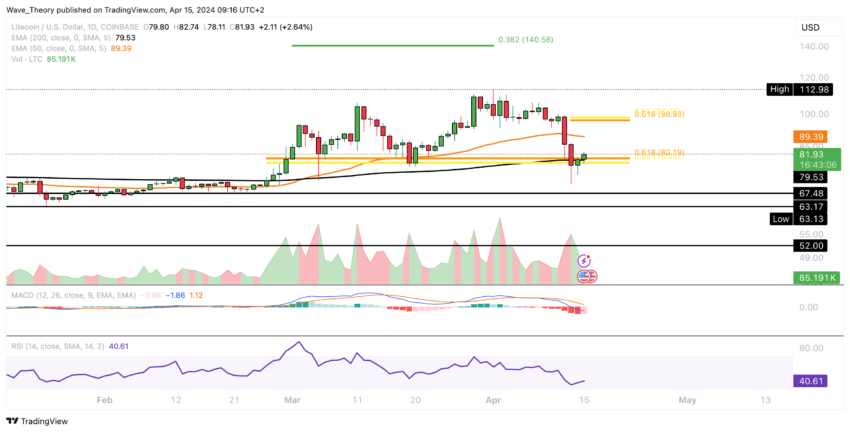
A breach beyond the golden ratio at $97 would signify the completion of the corrective phase, potentially paving the way for LTC to target the 0.382 Fib resistance at approximately $140.
Conversely, should LTC experience downward pressure, substantial support is anticipated between $63 and $67.5.
Bearish Signal: Litecoin’s 4H Chart Shows Death Cross Formation
An upward trajectory towards the Golden Ratio level at approximately $97 suggests a potential increase of around 18%. Notably, the MACD lines in the 4H chart have recently crossed bullishly, accompanied by a bullish uptick in the MACD histogram.
Meanwhile, the RSI remains in neutral territory. Short-term prospects favor a bullish trend.
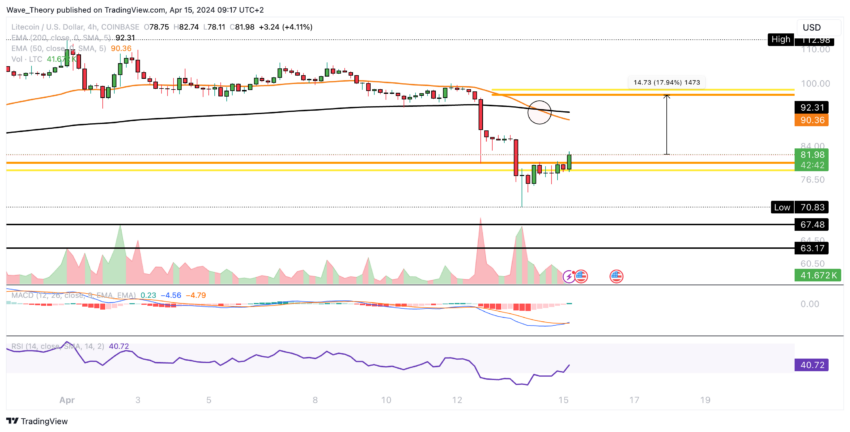
However, it’s essential to recognize that the trend has already been confirmed as bearish by the EMAs’ death cross, emphasizing the ongoing corrective phase.
Read More: Litecoin (LTC) Price Prediction 2024/2025/2030
Litecoin vs. Bitcoin: Emerging Silver Lining in Price Dynamics
Despite the significant downward trend in LTC price against Bitcoin, there are indications of a potential reversal. Notably, the MACD lines exhibit a bullish crossover on the weekly chart, while the RSI indicates a bullish divergence.
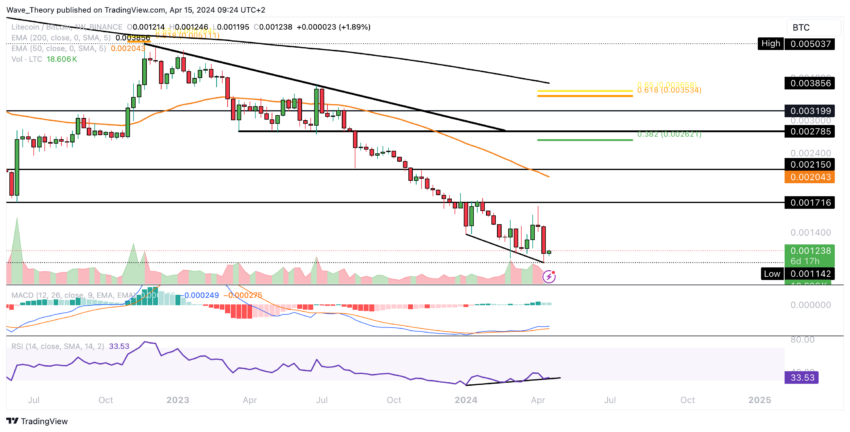
Should Litecoin commence an upward trajectory, it will encounter substantial resistance levels between approximately 0.001716 BTC and 0.00215 BTC. Additionally, the 50-week EMA presents a formidable barrier around 0.00204 BTC.


