The Uniswap (UNI) price has experienced a significant decline this month, halving in value. Since its peak last month, it has already fallen by over 65.4%.
Whether the UNI price will continue to decline further or experience an upswing in the near future depends on various factors, including market sentiment, investor activity, and broader market trends. It’s difficult to predict with certainty, but monitoring key support and resistance levels and relevant market indicators can provide insights into potential price movements.
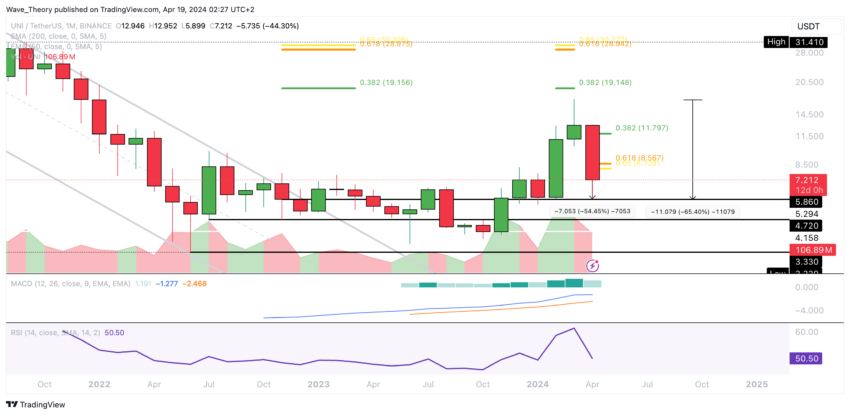
Uniswap Price Tumbles More Than 65% Since Last Month
The substantial decline in the Uniswap price, approximately 65.4% since last month and 54.5% this month reflects a significant downward trend. The Moving Average Convergence/Divergence Indicator (MACD) histogram is further evidenced by the bearish movement, which is beginning to show a bearish trend this month.
Despite this, the MACD lines remain crossed bullishly, and the Relative Strength Index (RSI) is currently neutral.
With Uniswap breaking the golden ratio support at approximately $8.5, it is now seeking substantial support from $4.72 to $5.86. This suggests a critical juncture for Uniswap as it navigates these support levels amid the broader market conditions.
Uniswap Price Approaching Critical Buy Zone
In the weekly chart, the recent bearish crossover of the MACD lines, coupled with the downward trend of the MACD histogram, suggests a shift toward bearish momentum for Uniswap. Concurrently, the RSI remains neutral, indicating no bullish or bearish sentiment.
Read More: How To Buy Uniswap (UNI) and Everything You Need To Know
Currently, Uniswap finds support at the 50-week EMA at around $7.54. However, there’s a possibility of a bearish break below this level. Should this occur, the price may retreat to the range between approximately $3.3 and $5.86.
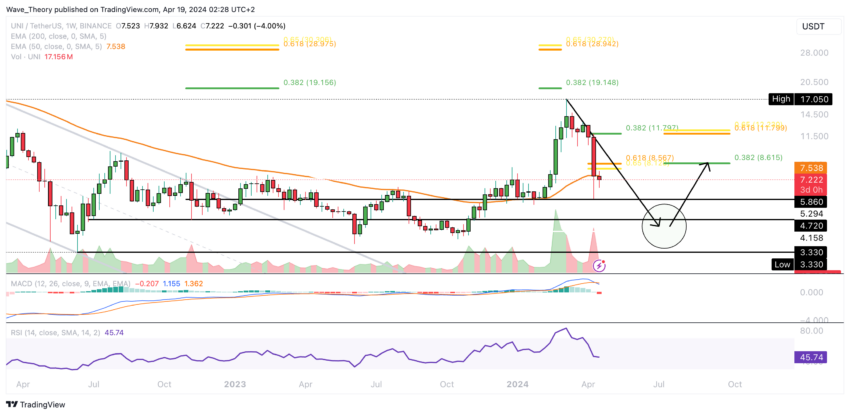
These levels could present attractive entry points for bullish investors, particularly if the price rebounds around $4.72, potentially targeting Fibonacci resistances at $8.615 or $12.
Golden Crossover Persists in Uniswap’s Daily Chart
In Uniswap’s daily chart, the continued presence of a golden crossover in the EMAs confirms the prevailing bullish trend in the short to medium-term. Additionally, the recent bullish trend observed in the MACD histogram over the past few days adds to this sentiment.
Should the price avoid forming a lower low and commence an upward trajectory from its current position, it may encounter significant Fibonacci resistance levels around $10.15 and $12.9.
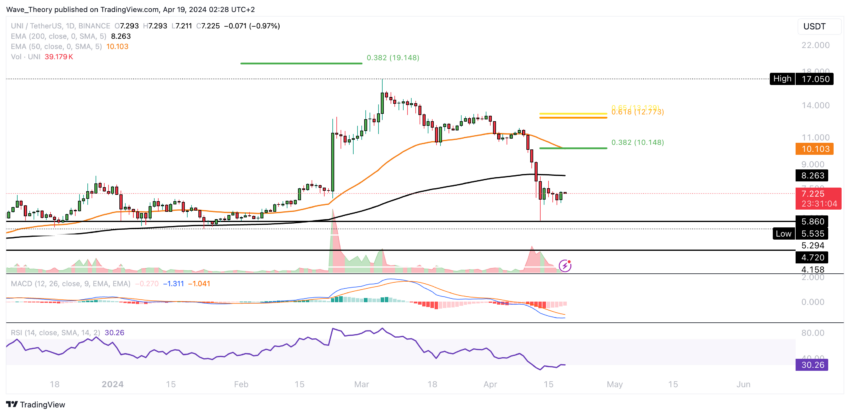
Notably, the $10.1 mark presents an additional resistance point, coinciding with the presence of the 50-day EMA.
Death Cross Formation in 4H Chart
In Uniswap’s 4-hour chart, the emergence of a death cross confirms the short-term bearish trend. However, it’s noteworthy that the MACD lines maintain a bullish crossover, while the MACD histogram, although exhibiting some bearish tendencies, has shown predominantly bullish movements.
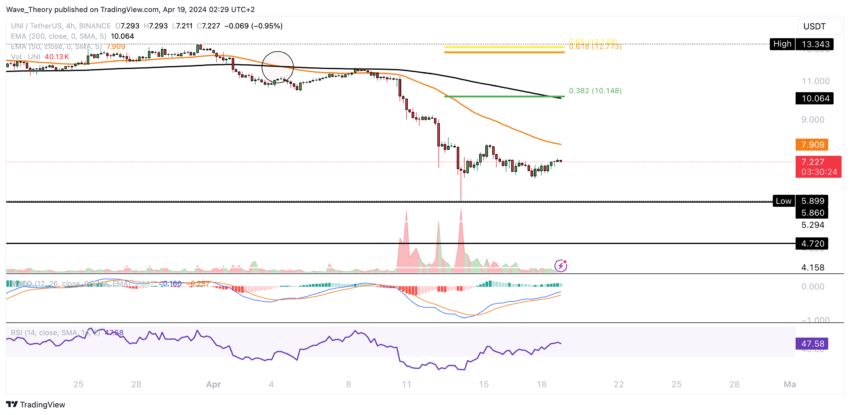
Despite these indicators, the RSI remains neutral, lacking clear signals as it oscillates within neutral territory.
Uniswap vs. Bitcoin: Navigating the Persistent Downward Channel
Against BTC, Uniswap has been confined within a parallel descending channel for an extended period. The weekly chart reveals a downward trend in the MACD histogram, indicating bearish momentum. Furthermore, the MACD lines crossed bearishly while the RSI remained neutral.
Read More: Uniswap (UNI) Price Prediction 2023/2025/2030
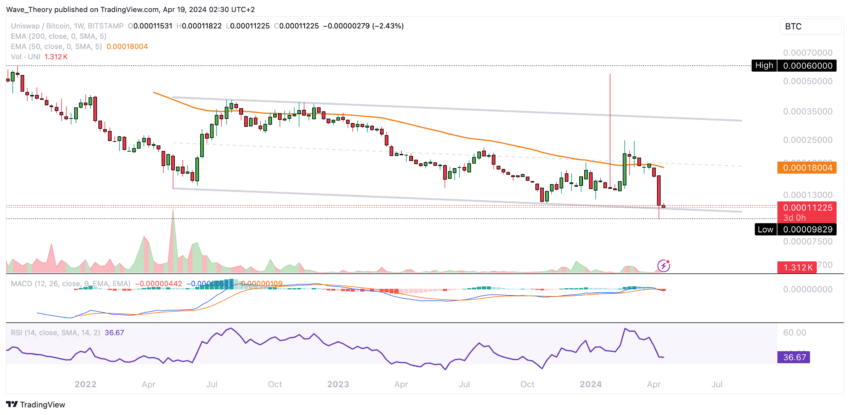
If Uniswap were to initiate an upward movement, it would face significant resistance at the 50-week EMA around 0.00018 BTC.


