The cryptocurrency market is experiencing a strong corrective phase, with the potential for further decline of up to 10%.
Although significant, it remains relatively mild by crypto standards. However, a more significant downturn would occur if the market descends to the golden ratio support level of around $1.45 trillion, essentially halving its value.
Market Down 23% and Falling – What’s Next?
The cryptocurrency market has corrected approximately 23% thus far, breaching key support levels such as the 50-day EMA and the .382 Fib support at around $2.237 trillion. This development suggests the possibility of a further correction towards the next Fibonacci support zone, ranging between approximately $1.9 trillion and $1.96 trillion.
A bullish rebound could occur upon reaching this support level, signaling a resumption of the upward trend. Alternatively, if the market continues to decline, the next significant support is expected around the 200-day EMA at approximately $1.856 trillion.
Regarding indicators, the Moving Average Convergence Divergence (MACD) histogram in the daily chart displays a bearish trend with downward ticks, accompanied by the bearish crossing of the MACD lines. However, the Relative Strength Index (RSI) is in neutral territory, providing no clear bullish or bearish signals.
Read More: Bitcoin Halving History: Everything You Need To Know
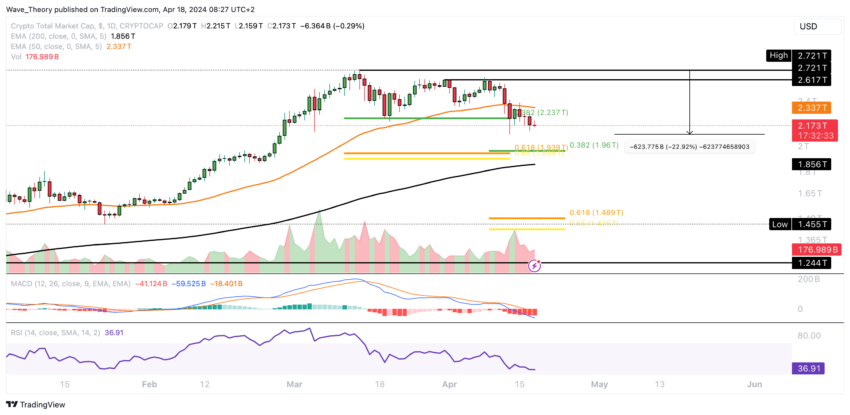
On a positive note, the EMAs still maintain a golden crossover, indicating a bullish trend in the short to medium term.
4H Chart Update: EMAs Signal a Death Cross Formation
In the 4-hour chart, the exponential moving averages (EMAs) form a death cross, signaling a short-term bearish trend. Additionally, the MACD lines may soon cross bearishly, as indicated by the downward ticks in the MACD histogram.
Despite this, the RSI remains neutral, offering no clear bullish or bearish signals. However, there is a possibility of a bullish divergence emerging in the RSI soon.
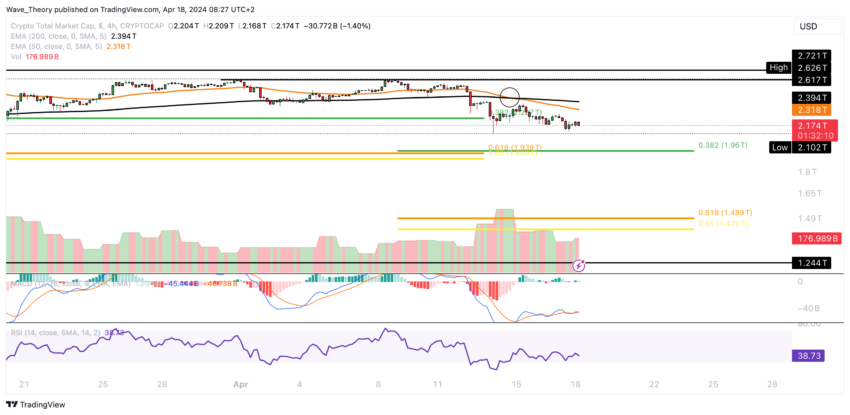
Given these indicators, it appears likely that the correction in the cryptocurrency market will persist. Consequently, the market may revisit the 0.382 Fibonacci support level at approximately $1.96 trillion soon.
Crypto Market Forecast: Is Another 11.6% Decline on the Horizon?
A descent to the subsequent Fibonacci support level suggests a downside potential of approximately 11.6%, indicating a possible decline of more than 10% once again for the crypto market. This scenario could prompt altcoins to undergo a more pronounced correction.
Moreover, the MACD lines are on the verge of forming a bearish crossover, while the MACD histogram has displayed bearish trends for three weeks.
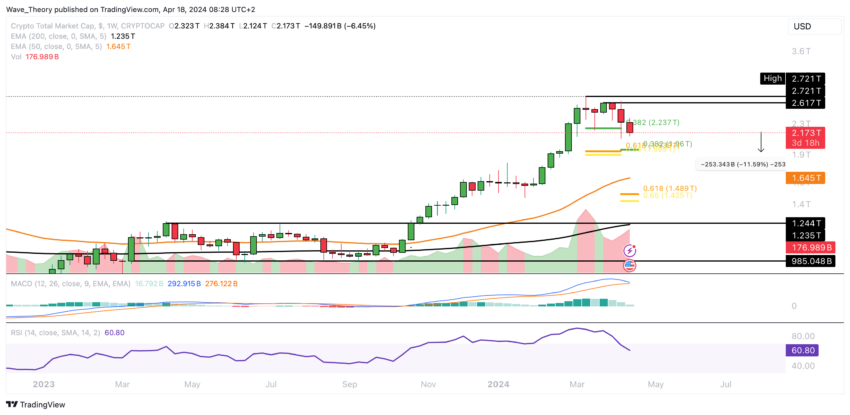
Additionally, the RSI is transitioning back into the neutral zone after previously being in overbought territories.
Exploring Potential Supports for Crypto in Case of a Massive Correction
If the crypto market experiences a significant downturn and breaks below the Fibonacci support range between approximately $1.9 trillion and $1.96 trillion in a bearish manner, the next significant Fibonacci support level would only be around $1.45 trillion.
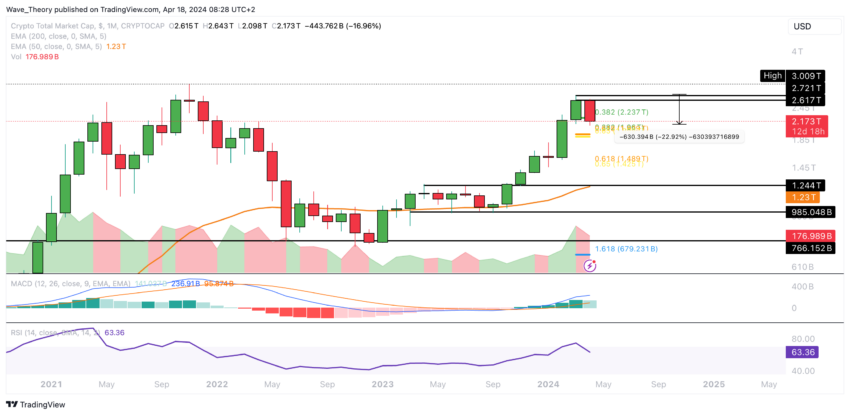
Maintaining the market above this level is crucial to sustain the bullish momentum. Alternatively, if this support is breached, significant support can be expected at the 50-month EMA, located at approximately $1.23 trillion.
Read More: Best Crypto AI Trading Apps in 2024
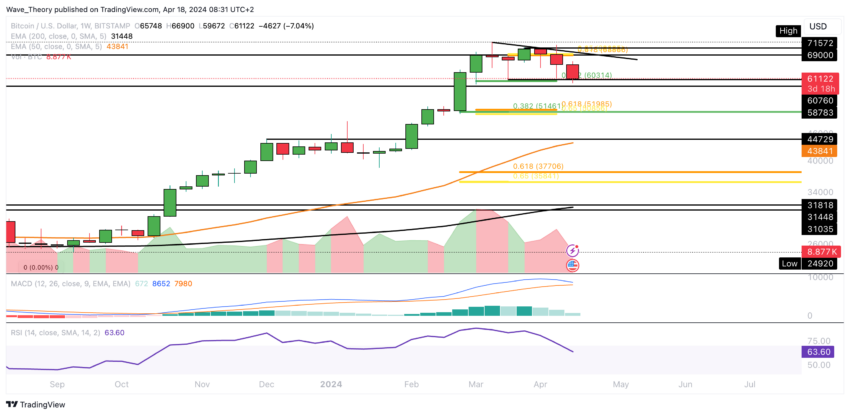
Identifying Key Support Levels for Bitcoin Amidst Price Fluctuations
Bitcoin has currently reached the 0.382 Fibonacci support level at approximately $60,300. Should this support level fail to hold, the next significant Fibonacci supports are anticipated to be between $51,000 and $52,000.