The Cardano (ADA) price has experienced a significant upward trend in recent weeks. However, there are indications that ADA may be entering a correction phase.
How low will the ADA price fall? Or will things soon look up for Cardano?
Cardano Begins Correction: Is a Retreat to $0.3 Golden Ratio Looming?
The Cardano (ADA) price has begun a correction after its recent surge. It has been in a downward trend for the past three days, which suggests the possibility of a further correction down to the 0.382 Fibonacci support level at approximately $0.344.
If this support level is breached, the next significant Fibonacci support is located at the Golden Ratio around $0.3.
Despite the current correction, it’s worth noting that there is still a golden crossover in the daily chart, indicating that the overall trend remains bullish in the short to medium term.
However, other indicators like the MACD histogram, which has been trending bearishly lower for three days, and the bearish crossover of the MACD lines suggest short-term bearish sentiment.
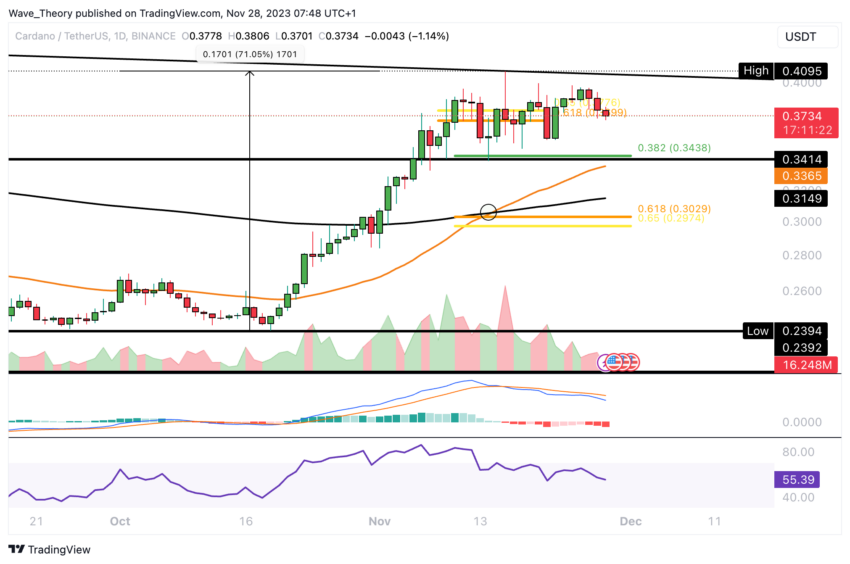
The RSI, on the other hand, is currently in the neutral zone, providing neither bullish nor bearish signals.
Cardano’s Price Forecast: Facing a Potential 20% Drop?
If Cardano experiences a correction and only retraces to the 0.382 Fibonacci support level at approximately $0.344, this would represent a potential downside of around 8%. However, if Cardano corrects to the golden ratio at around $0.3, the potential downside could be as much as 19%.
This means that Cardano could undergo a correction of approximately 20% without invalidating its overall upward movement. As long as Cardano remains above the golden ratio support at approximately $0.3, the bullish trend remains intact.
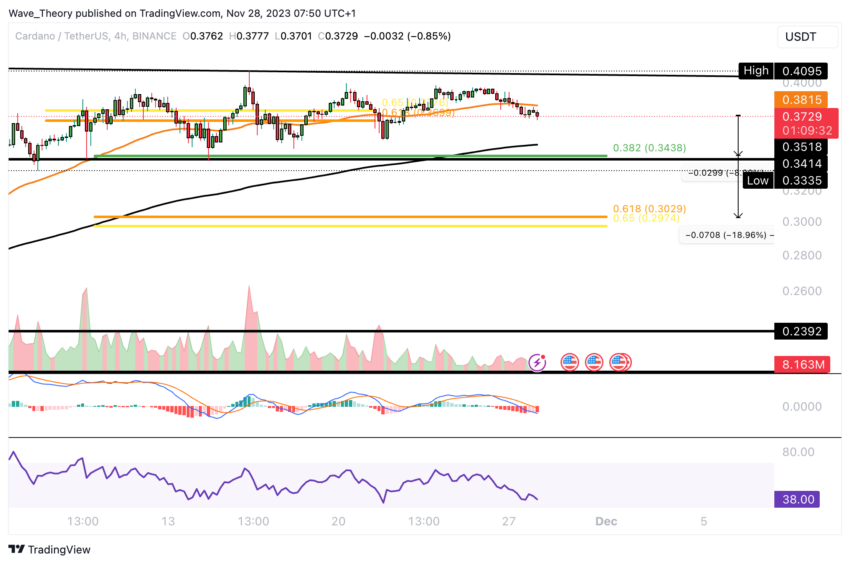
In the 4-hour chart, the EMAs (Exponential Moving Averages) are still in a golden crossover, indicating that the short-term trend remains bullish. However, the MACD lines have crossed bearishly, and the MACD histogram is trending lower in a bearish manner.
The RSI, while in neutral territory, does not provide clear bullish or bearish signals at the moment.
ADA Price Correction Phase Kicks Off This Week
In the weekly chart, it appears that a correction may commence this week. So far this week, the MACD histogram is trending lower in a bearish manner.
Although the MACD lines are still crossed bullishly, and the RSI remains in neutral territory, the EMAs do not indicate a death cross. However, this suggests that the medium-term trend is still bearish.
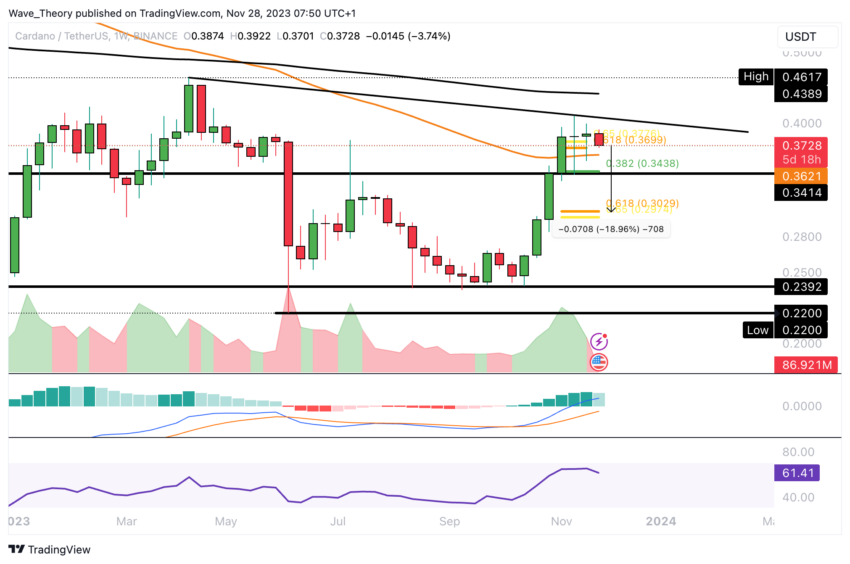
If Cardano undergoes a bearish break below the golden ratio support at approximately $0.3, it will signal a return to the downtrend. In such a scenario, Cardano could correct to the horizontal support zone ranging from around $0.22 to $0.24.
Has This Cycle’s Peak Been Reached?
Whether Cardano has reached its peak in this cycle and is returning to a downtrend hinges on whether it breaks the golden ratio support at approximately $0.3.
The MACD lines are on the verge of crossing bullishly, with the MACD histogram displaying a consistent uptrend. The RSI, however, remains neutral and does not provide clear bullish or bearish signals.
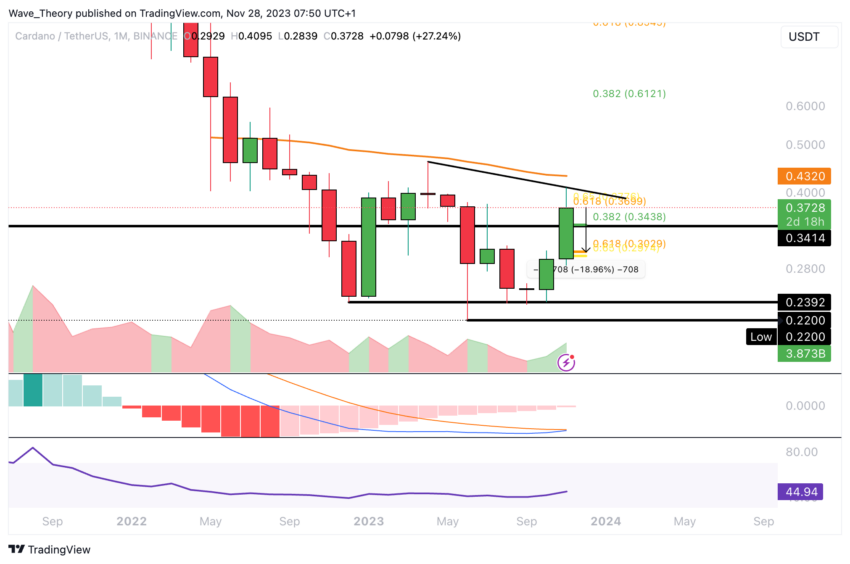
If Cardano’s correction is merely a pause before resuming its upward trajectory, it will encounter resistance at the Golden Ratio around $0.37 and the next significant resistance at approximately $0.43.
Cardano Faces Bearish Rejection at 0.382 Fib Level Against Bitcoin, at 0.00001033 BTC
Against Bitcoin, Cardano faced a bearish rejection at the 0.382 Fibonacci resistance level, located around 0.00001034 BTC. As a result, Cardano is currently heading towards the next Fibonacci support levels at approximately 0.00000984 BTC and 0.0000091 BTC.
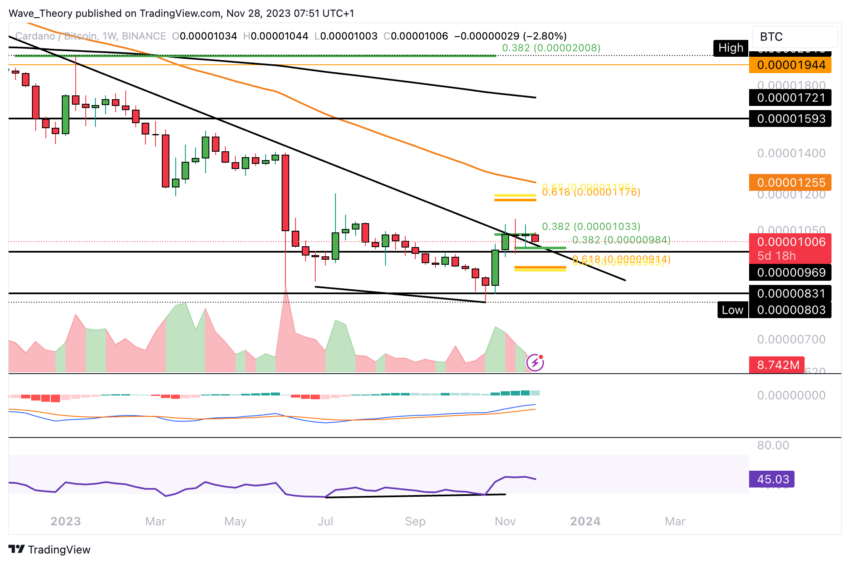
Additionally, the MACD histogram has started to tick lower in a bearish manner this week, although the MACD lines are still crossed in a bullish manner. The RSI is currently in the neutral zone, providing neither clear bullish nor bearish signals.