
The XRP price experienced a significant rally, reaching the golden ratio resistance level. However, it faced a sharp and bearish rejection at this point. As a result, the corrective movement in the XRP price remains ongoing.
The Ripple price faced a bearish rejection at the golden ratio resistance level, which is situated around $0.75. Currently, Ripple is encountering significant Fibonacci support.
Will XRP Rebound to 50-Month EMA Support?
Ripple faced a significant challenge in breaking through the golden ratio resistance at approximately $0.75, preventing it from reaching the 382 Fibonacci level at around $0.923, where it previously experienced a bearish rejection a few months ago.
Despite this strong bearish rejection at the golden ratio resistance, the monthly chart shows the MACD histogram continuing to trend bullishly higher, and the MACD lines remain crossed in a bullish manner.
Meanwhile, the RSI is currently in neutral territory, providing no clear bullish or bearish signals.

If Ripple fails to experience a bullish rebound from the upcoming Fibonacci support levels, it could potentially undergo a correction, with the 50-month EMA support at around $0.512 serving as a medium-term support level.
Weekly MACD Histogram Decline: Signs of Bearish Shift for XRP
In the weekly chart, a bearish signal is emerging as the MACD histogram has been declining in a bearish manner since the previous week, potentially indicating a future bearish crossover of the MACD lines.
Simultaneously, the RSI is hovering in neutral territory, and the Exponential Moving Averages (EMAs) still maintain a golden crossover, signifying a medium-term bullish trend.
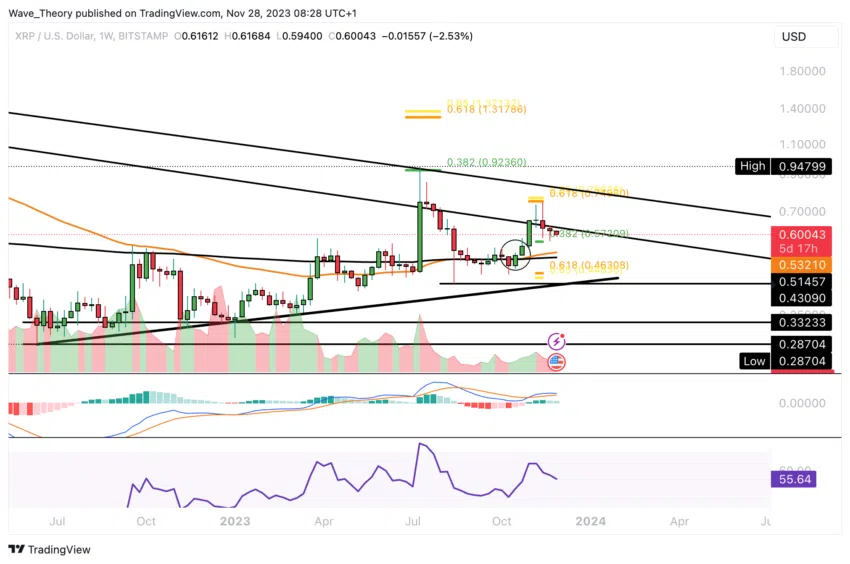
However, it’s worth noting that Ripple seems to be forming a lower high following the bearish rejection at the Fibonacci resistance. This lower high is a significant bearish indicator and suggests a continuation of the underlying downtrend.
It’s important to consider this within the context of the broader crypto market, which is currently in a bearish phase.
XRP Price Update: Recent Rebound from $0.572, a Key 0.382 Fibonacci Level
Ripple recently touched the 0.382 Fibonacci support level at approximately $0.572, experiencing a bullish bounce from this point. However, it appears that Ripple is now resuming its correction.
This could indicate ongoing price volatility and a potential retest of lower support levels. Traders and investors should closely monitor the price action and key support levels to assess the direction of Ripple’s movement in the short to medium term.
Ripple is currently facing a key support level at approximately $0.46, as indicated by the next significant Fibonacci support. This level will be important to watch as it could determine whether the bullish upward trend remains intact or if Ripple might see a deeper correction.
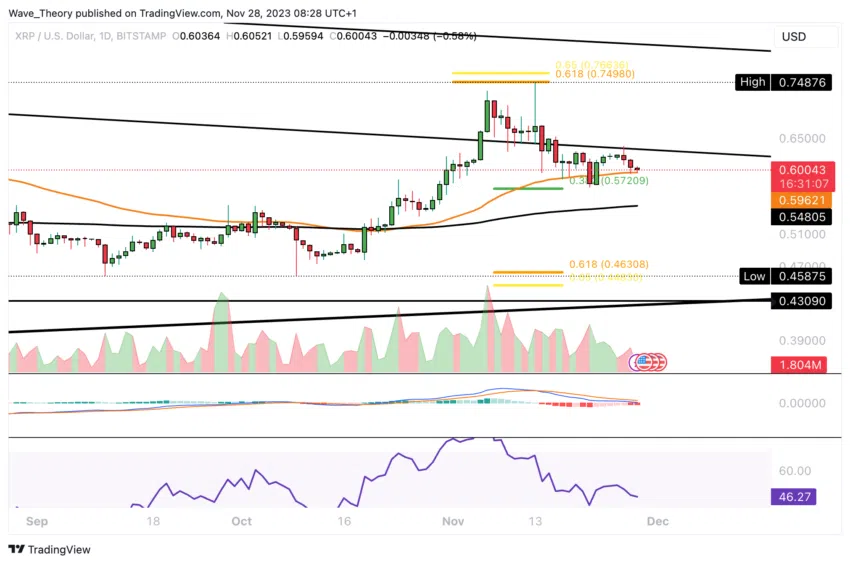
The technical indicators provide mixed signals, with the MACD histogram showing bearish movement and the MACD lines crossed bearishly while the RSI remains in neutral territory.
However, it’s worth noting that the EMAs still exhibit a golden crossover in the daily chart, which suggests a bullish trend in the short to medium term.
Traders and investors should closely monitor the price action around the $0.46 support level to assess whether Ripple can maintain its bullish momentum or if further correction is likely.
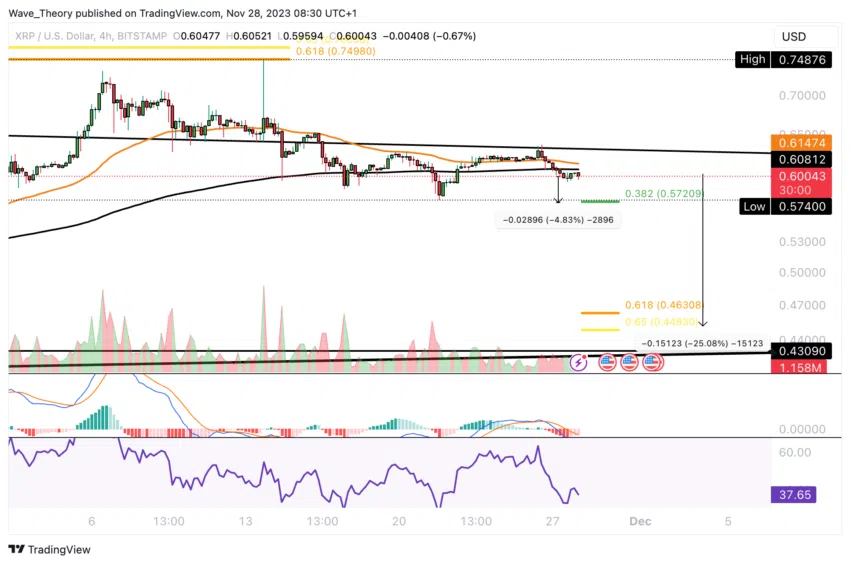
Potential Death Cross in XRP’s 4H Chart: Forecasting the Price Drop
In the 4-hour chart, there’s a potential for a death cross to form, which would signify a bearish trend in the short term. Furthermore, the MACD lines have already crossed bearishly, and the RSI is nearing overbought territory.
It’s worth noting that despite these bearish signals, the MACD histogram shows some bullish movement. Currently, Ripple has approximately 5% of room to move downward before reaching the next Fibonacci support.
Traders should closely monitor these technical indicators and price levels to assess whether Ripple might experience further short-term bearishness or if it could find support and reverse its trend.
XRP’s Correction to the $0.46 Golden Ratio Suggests a 25% Downside Risk.
Ripple at Golden Ratio Support Against Bitcoin: Holds at 0.0000155 BTC
Against Bitcoin, Ripple has returned to the golden ratio support level at approximately 0.0000155 BTC. It’s worth noting that Ripple has been trading within a range bounded by the golden ratio resistance at around 0.000029 BTC and the golden ratio support at about 0.0000155 BTC for the past 15 months.
Additionally, the MACD histogram on the monthly chart has been trending lower in a bearish manner for several months, indicating the potential for a bearish crossover of the MACD lines. The RSI is currently in the neutral zone.
In the most recent month, Ripple faced bearish rejection at the Golden Ratio resistance around 0.000021 BTC. If Ripple manages to surpass this resistance level, the next significant hurdle for the price would be the 50-month EMA at approximately 0.0000235 BTC.
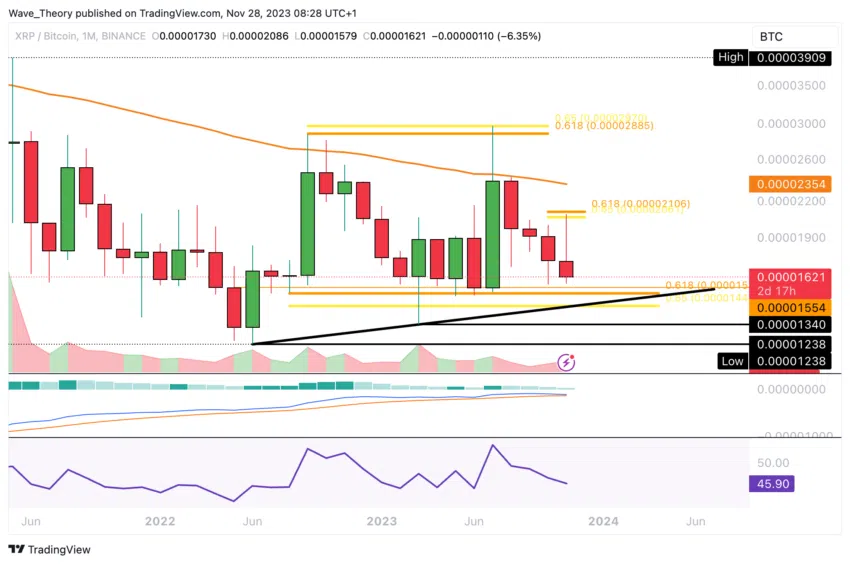
Traders should keep a close eye on these critical levels and the evolving technical indicators to gauge the potential direction of Ripple’s price against Bitcoin.


