The Bitcoin Cash (BCH) price surged by over 133% last month, reaching the Fibonacci level of around $681. However, it faced a bearish rejection at that point.
Consequently, Bitcoin Cash is currently undergoing a corrective movement this month. The duration of this correction remains uncertain.
Bitcoin Cash’s Stellar Month: Price Surges by Over 133%
Last month, the Bitcoin Cash price surged approximately 133.5%, reaching the 0.382 Fibonacci level at around $681. However, this marked level posed significant resistance, triggering a corrective movement this month.
Indeed, the price has since undergone a correction of over 38%. Presently, Bitcoin Cash is encountering notable Fibonacci support around $480. Furthermore, should this support falter, significant golden ratio support lies at approximately $325, with the 50-month EMA as additional reinforcement.
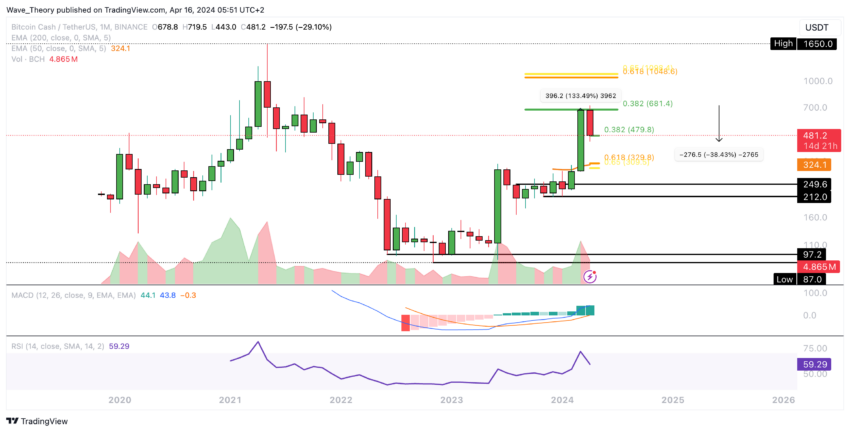
Examining the monthly chart, the Moving Average Convergence Divergence (MACD) histogram trends bullishly higher, accompanied by bullishly crossed MACD lines, while the Relative Strength Index (RSI) maintains a neutral stance.
Read More: Bitcoin Cash: A Complete Guide to What It Is and How It Works
Bitcoin Cash’s Weekly Chart Hints at Potential Golden Crossover
In the weekly chart of Bitcoin Cash, there’s a potential for the EMAs to form a golden crossover, signaling a bullish trend in the medium term. The MACD lines have already crossed in a bullish manner, although the MACD histogram has been declining bearishly since last week.
Meanwhile, the RSI indicates neutral territory. Bitcoin Cash (BCH) promises to rebound from the .382 Fib support around $480.
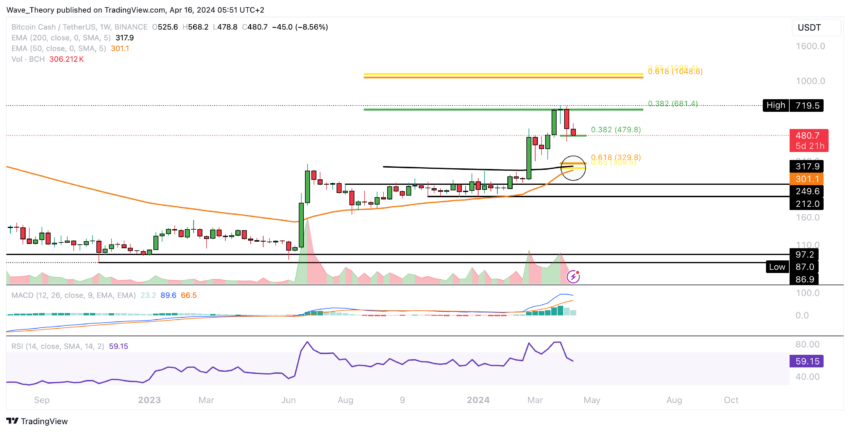
Subsequently, BCH may attempt to breach the .382 Fib resistance at approximately $681.4. A successful breakout could pave the way for a bullish trajectory towards the next target of around $1,050.
Should Bitcoin Cash surpass the golden ratio at approximately $1,050, it would signify a new bullish cycle for the cryptocurrency
Daily Market Update: Bitcoin Cash Shows Bearish Signals
In the daily chart of Bitcoin Cash, the indicators signal bearish trends, with the MACD histogram trending downward and the MACD lines crossed bearishly.
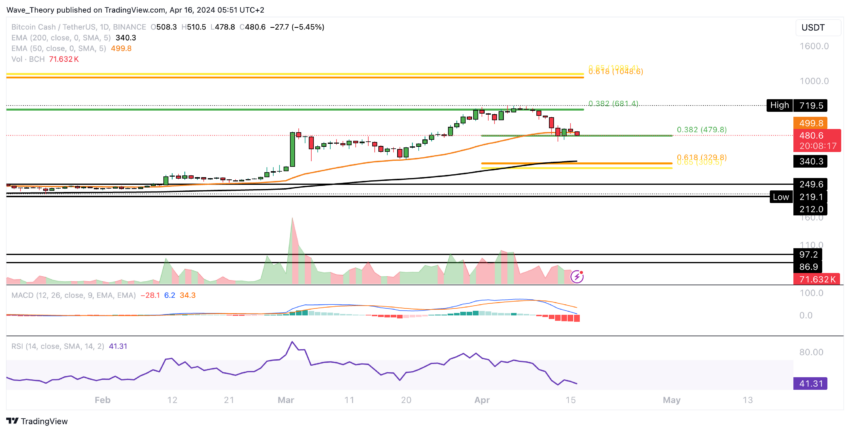
The RSI is currently in neutral territory. In the event of Bitcoin Cash (BCH) breaking its current support levels, notable support can be expected at the Golden Ratio of around $325, with additional reinforcement provided by the 200-day EMA at just under $340
Bitcoin Cash 4H Chart Update: Death Cross Formation Ahead?
In the 4-hour chart of Bitcoin Cash (BCH), there is a possibility of a death cross formation, which would solidify the trend as bearish in the short term. Additionally, the MACD histogram is showing a downward trend, indicating bearish momentum.
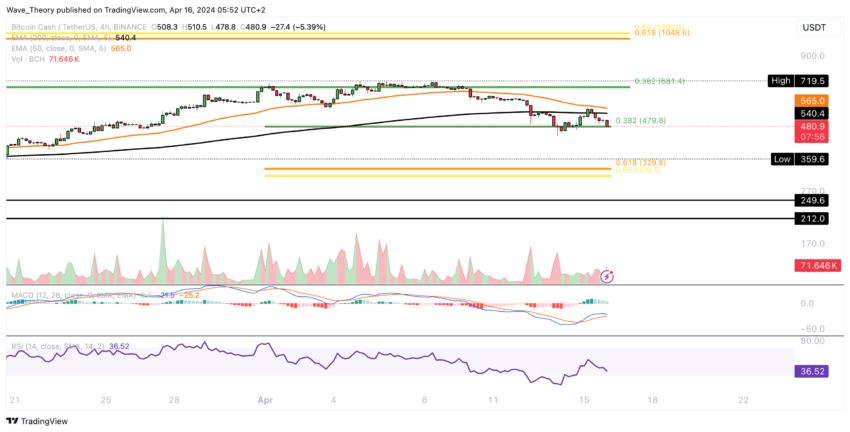
The MACD lines are approaching a potential bearish crossover. However, the RSI is currently in neutral territory, providing neither bullish nor bearish signals.
BTC vs. BCH: Bitcoin Cash Hits Resistance and Turns Bearish
Against BTC, Bitcoin Cash faced a bearish rejection at the resistance zone spanning from approximately 0.00999 BTC to 0.0108 BTC. The BCH price encounters significant Fibonacci supports at around 0.0079 BTC and 0.0062 BTC.
Read More: Bitcoin Cash (BCH) Price Prediction 2024/2025/2030
While the MACD lines maintain a bullish crossover on the monthly chart, the MACD histogram shows a bearish inclination this month alongside a neutral RSI.
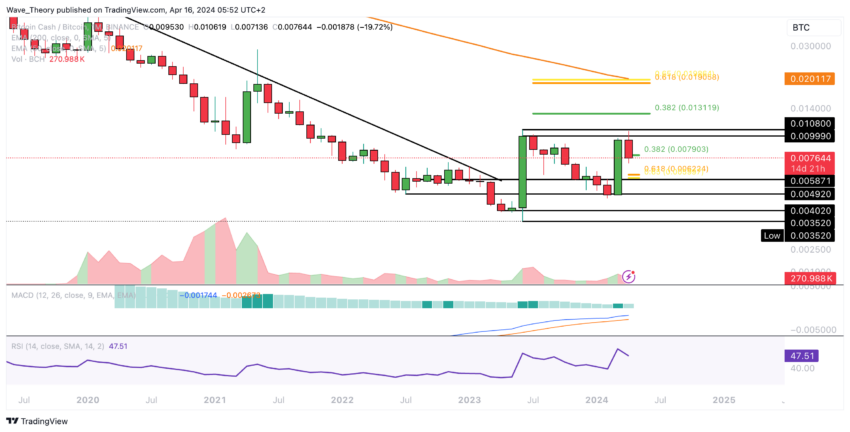
The current outlook for Bitcoin Cash appears bearish, potentially prompting investors to favor purchasing Bitcoin, which is also experiencing a corrective phase.


