
The Shiba Inu (SHIB) price is making its fourth attempt at breaking out from a descending resistance line that existed for 570 days.
In the short term, SHIB trades close to a confluence of diagonal resistance levels. Will it break out?
Shiba Inu Attempts Breakout From Long-Term Resistance
The weekly time frame technical analysis shows that SHIB is in the process of breaking out from a descending resistance trend line that has existed for nearly 570 days. Until now, the trend line has caused three rejections (red icons).
Despite the increase, the SHIB price has not yet reached a weekly close above the trend line. Also, it trades inside a long-term horizontal resistance area which existed for nearly a year.
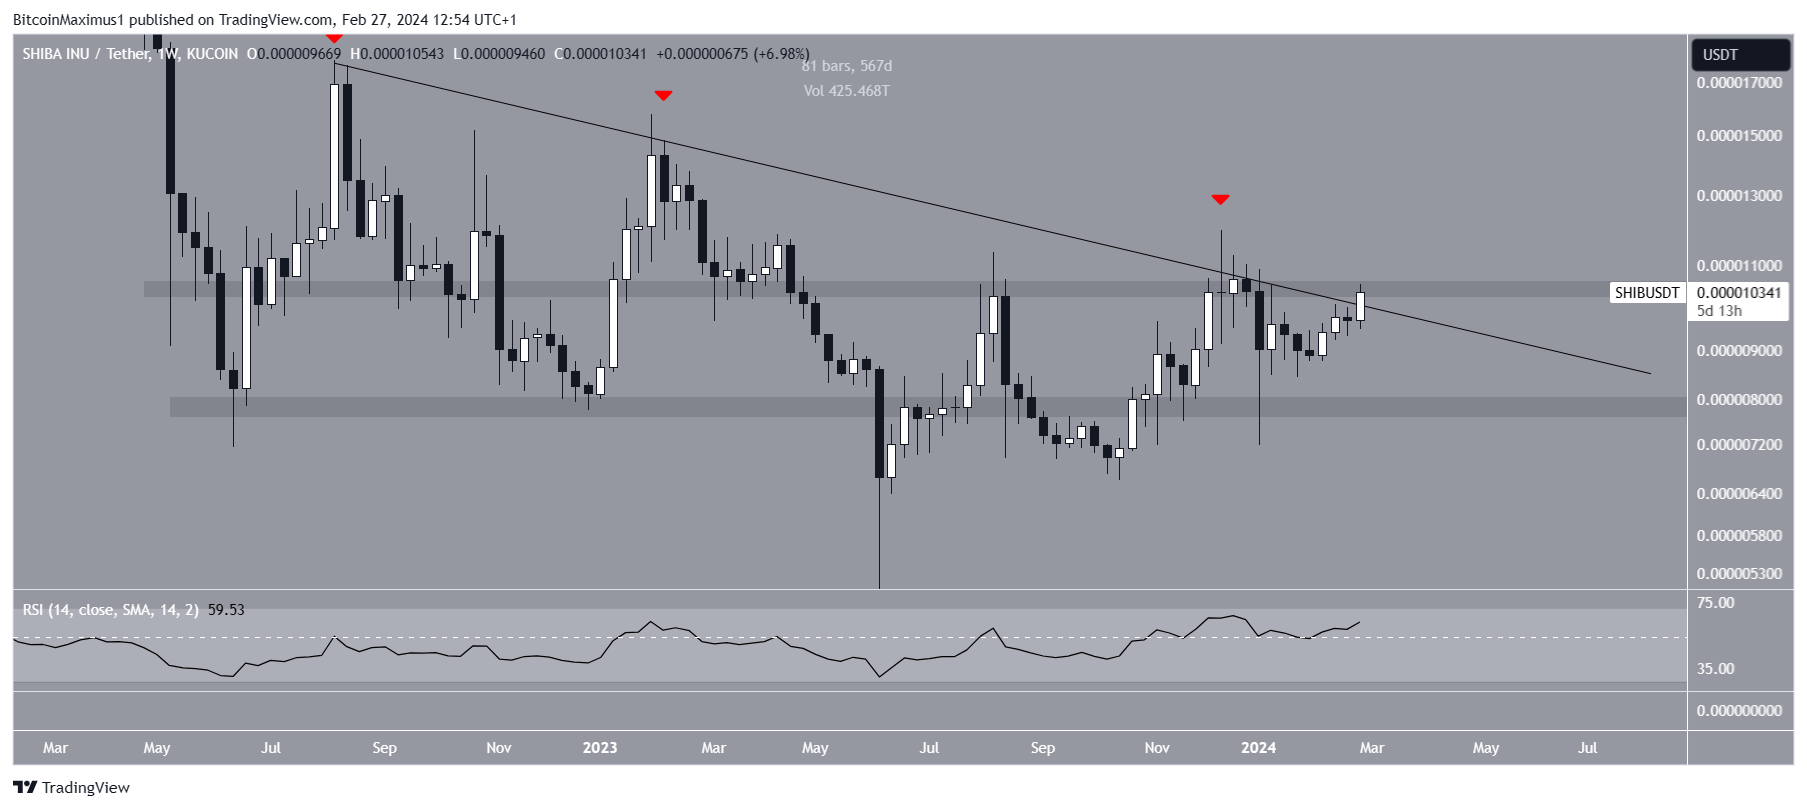
While the price has not broken out yet, the Relative Strength Index (RSI) is already bullish. Traders utilize the RSI as a momentum indicator to assess whether a market is overbought or oversold and whether to accumulate or sell an asset.
If the RSI reading is above 50 and the trend is upward, bulls still have an advantage, but if the reading is below 50, the opposite is true. The RSI is above 50 and increasing, both signs of a bullish trend.
SHIB Price Prediction: Will the Breakout Be Successful?
The daily time frame chart suggests that SHIB will successfully break out. The bullish prediction comes from the price action and RSI readings.
The price action shows that SHIB trades inside a long- and short-term ascending parallel channel. It is currently attempting to break out from the middle of the long-term channel and the resistance of the short-term one (red icon).
The daily RSI supports the SHIB breakout, which is above 50 and moving upwards. If SHIB breaks out, it can increase by nearly 25% to the long-term channel’s resistance trend line at $0.0000128.
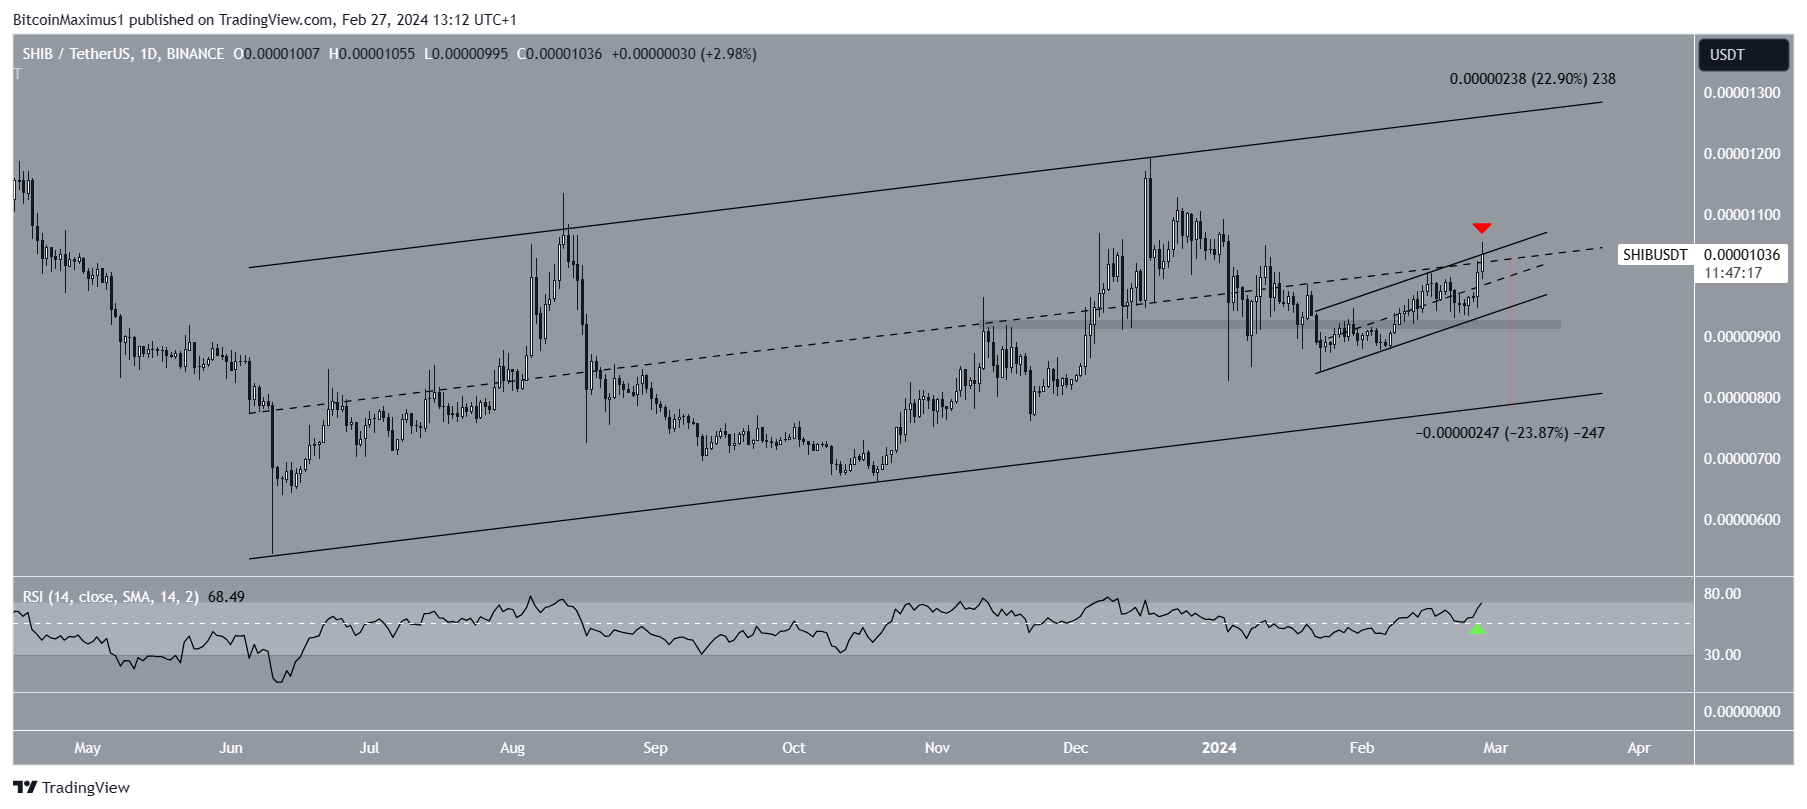
Despite this bullish SHIB price prediction, failure to break out from the short-term channel can trigger a 25% decrease to the long-term channel’s support trend line at $0.0000080.
For BeInCrypto‘s latest crypto market analysis, click here.


