
The price of Bitcoin (BTC) reached a higher high recently but has not yet surpassed the all-time high (ATH) of around $73,800.
Over the past week, BTC saw an increase from approximately $64,500 to around $72,750 before experiencing a decline again yesterday.
Bitcoin Rallies: A Notable 12.7% Gain Over Seven Days
After reaching a local low at approximately $64,500, BTC experienced a significant rally, resulting in a price increase of around 12.7%. However, since yesterday, the BTC price has been retracing again, bringing it back to the golden ratio at around $68,850.
At this level, BTC may find support and potentially bounce upwards. Should the price break below this Fibonacci level in a bearish manner, the next significant Fibonacci supports are expected to be around $60,314 and $51,900.
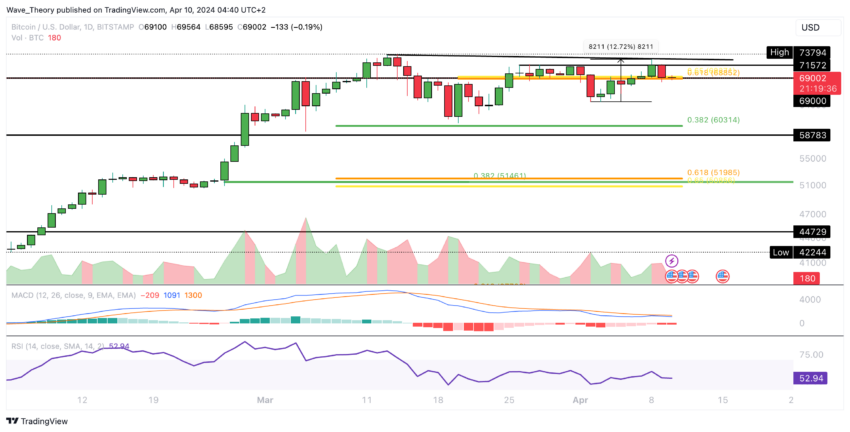
Additionally, in the daily chart, the MACD lines have crossed bearishly, and the MACD histogram has been decreasing in a bearish manner since yesterday. Meanwhile, the Relative Strength Index (RSI) is in neutral territory, indicating neither bullish nor bearish signals at the moment.
Bitcoin 4H Outlook: Indicators Suggest a Near-Term Downturn
In the 4-hour (4H) chart, Bitcoin’s price movement is bearish, with the MACD histogram trending downwards and the MACD lines crossing bearishly. Concurrently, the Relative Strength Index (RSI) oscillates in neutral territory, neither indicating strong bullish nor bearish sentiments.
Read More: What Happened at the Last Bitcoin Halving? Predictions for 2024
Crucially, BTC’s further development hinges on whether the golden ratio support level of around $69,000 can effectively act as a floor for price action. This level is a pivotal point, as a successful bounce off this support could signal renewed bullish momentum for BTC, potentially paving the way for further upward movement.
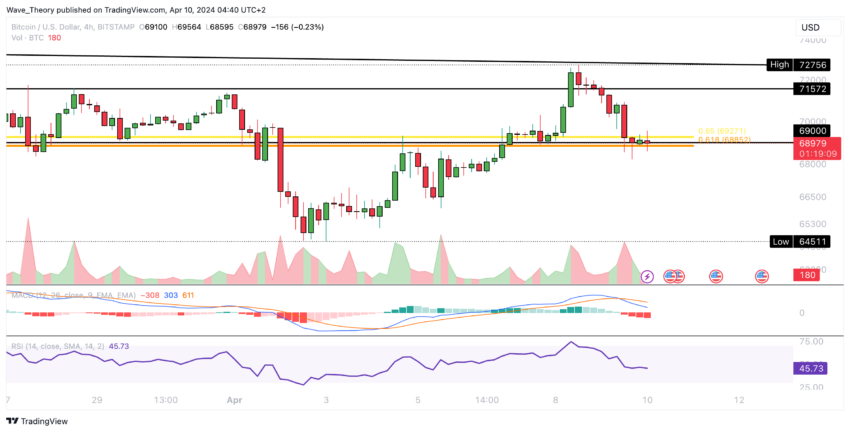
Conversely, a breach below this support level might lead to additional downside pressure, with the next significant support zones coming into play around $60,314 and $51,900.
Weekly Bitcoin Analysis: MACD Histogram Declines, Signaling Bearish Trend
In the weekly chart, Bitcoin’s price dynamics exhibit a mixed signal, with the histogram of the Moving Average Convergence Divergence (MACD) indicator starting to trend lower in a bearish manner since the previous week. Despite this, the MACD lines remain crossed in a bullish configuration.
Moreover, the RSI is currently situated in overbought regions, although it is approaching neutral territory. In the event of a moderate correction, BTC may find substantial Fibonacci support around the $51,800 level.
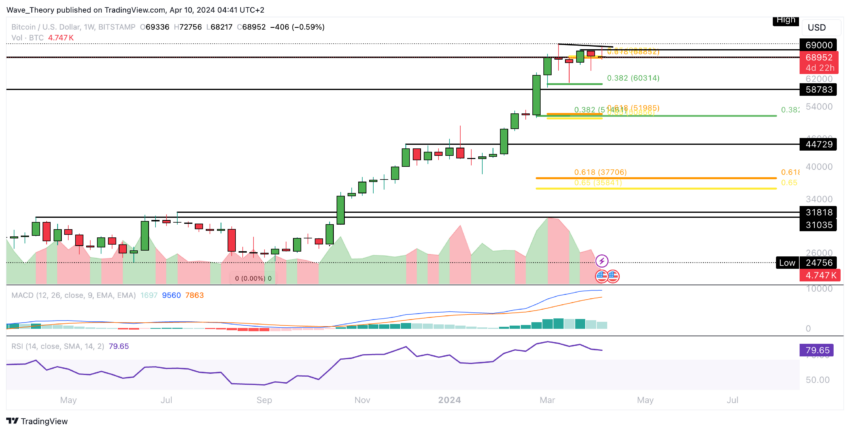
A potential bounce from this support zone could signal a resumption of the upward trend for BTC as investors and traders assess the market sentiment and price action for indications of renewed bullish momentum.
Bitcoin’s Monthly Chart: Still No Signs of a Bearish Turn
The monthly chart shows that BTC price dynamics lack bearish signals per the indicators. Despite the RSI residing in slightly overbought territories, other metrics indicate a bullish bias.
The MACD histogram continues to trend upwards, indicating positive momentum, while the MACD lines maintain a bullish crossover configuration. This suggests ongoing strength in the market sentiment.
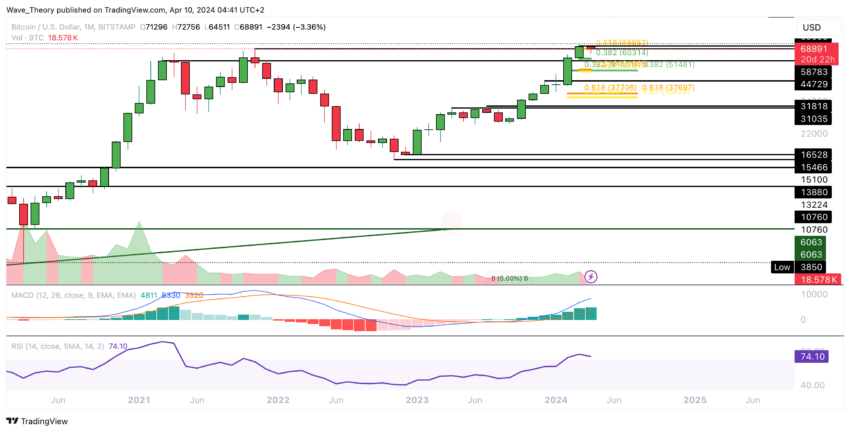
Overall, the bullish trajectory remains intact, contingent upon BTC sustaining its position above the critical golden ratio support level situated around $37,000. This support zone is a crucial determinant for the longevity of the prevailing upward trend in Bitcoin’s price movement.
Bitcoin’s Market Grip Strengthens Within Upward Parallel Channel
Bitcoin dominance is trending within a parallel upward channel, indicating its resilience in the market. The next noteworthy Fibonacci resistance level stands at approximately 60.5%.
Read More: Bitcoin Price Prediction 2024/2025/2030
BTC dominance finds substantial support zones at around 49% and 45%, delineating crucial levels where market sentiment may shift. Additionally, the MACD histogram in the weekly chart shows signs of bullish momentum, with a bullish uptick observed.
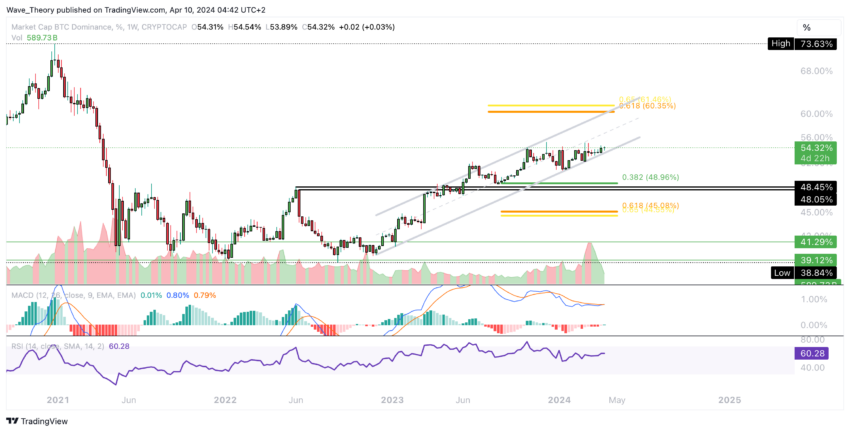
Furthermore, there is a potential impending bullish crossover of the MACD lines, signaling further strength in Bitcoin dominance. However, it’s noteworthy that the RSI is currently in neutral territory, posing a risk of establishing a bearish divergence if not closely monitored.


