
Render (RNDR) and Fetch.ai (FET) are two Artificial Intelligence (AI) tokens that are approaching their all-time highs.
Will these two AI tokens reach new all-time highs, and how much will they continue afterward? Let’s find out!
RNDR Leads AI Tokens
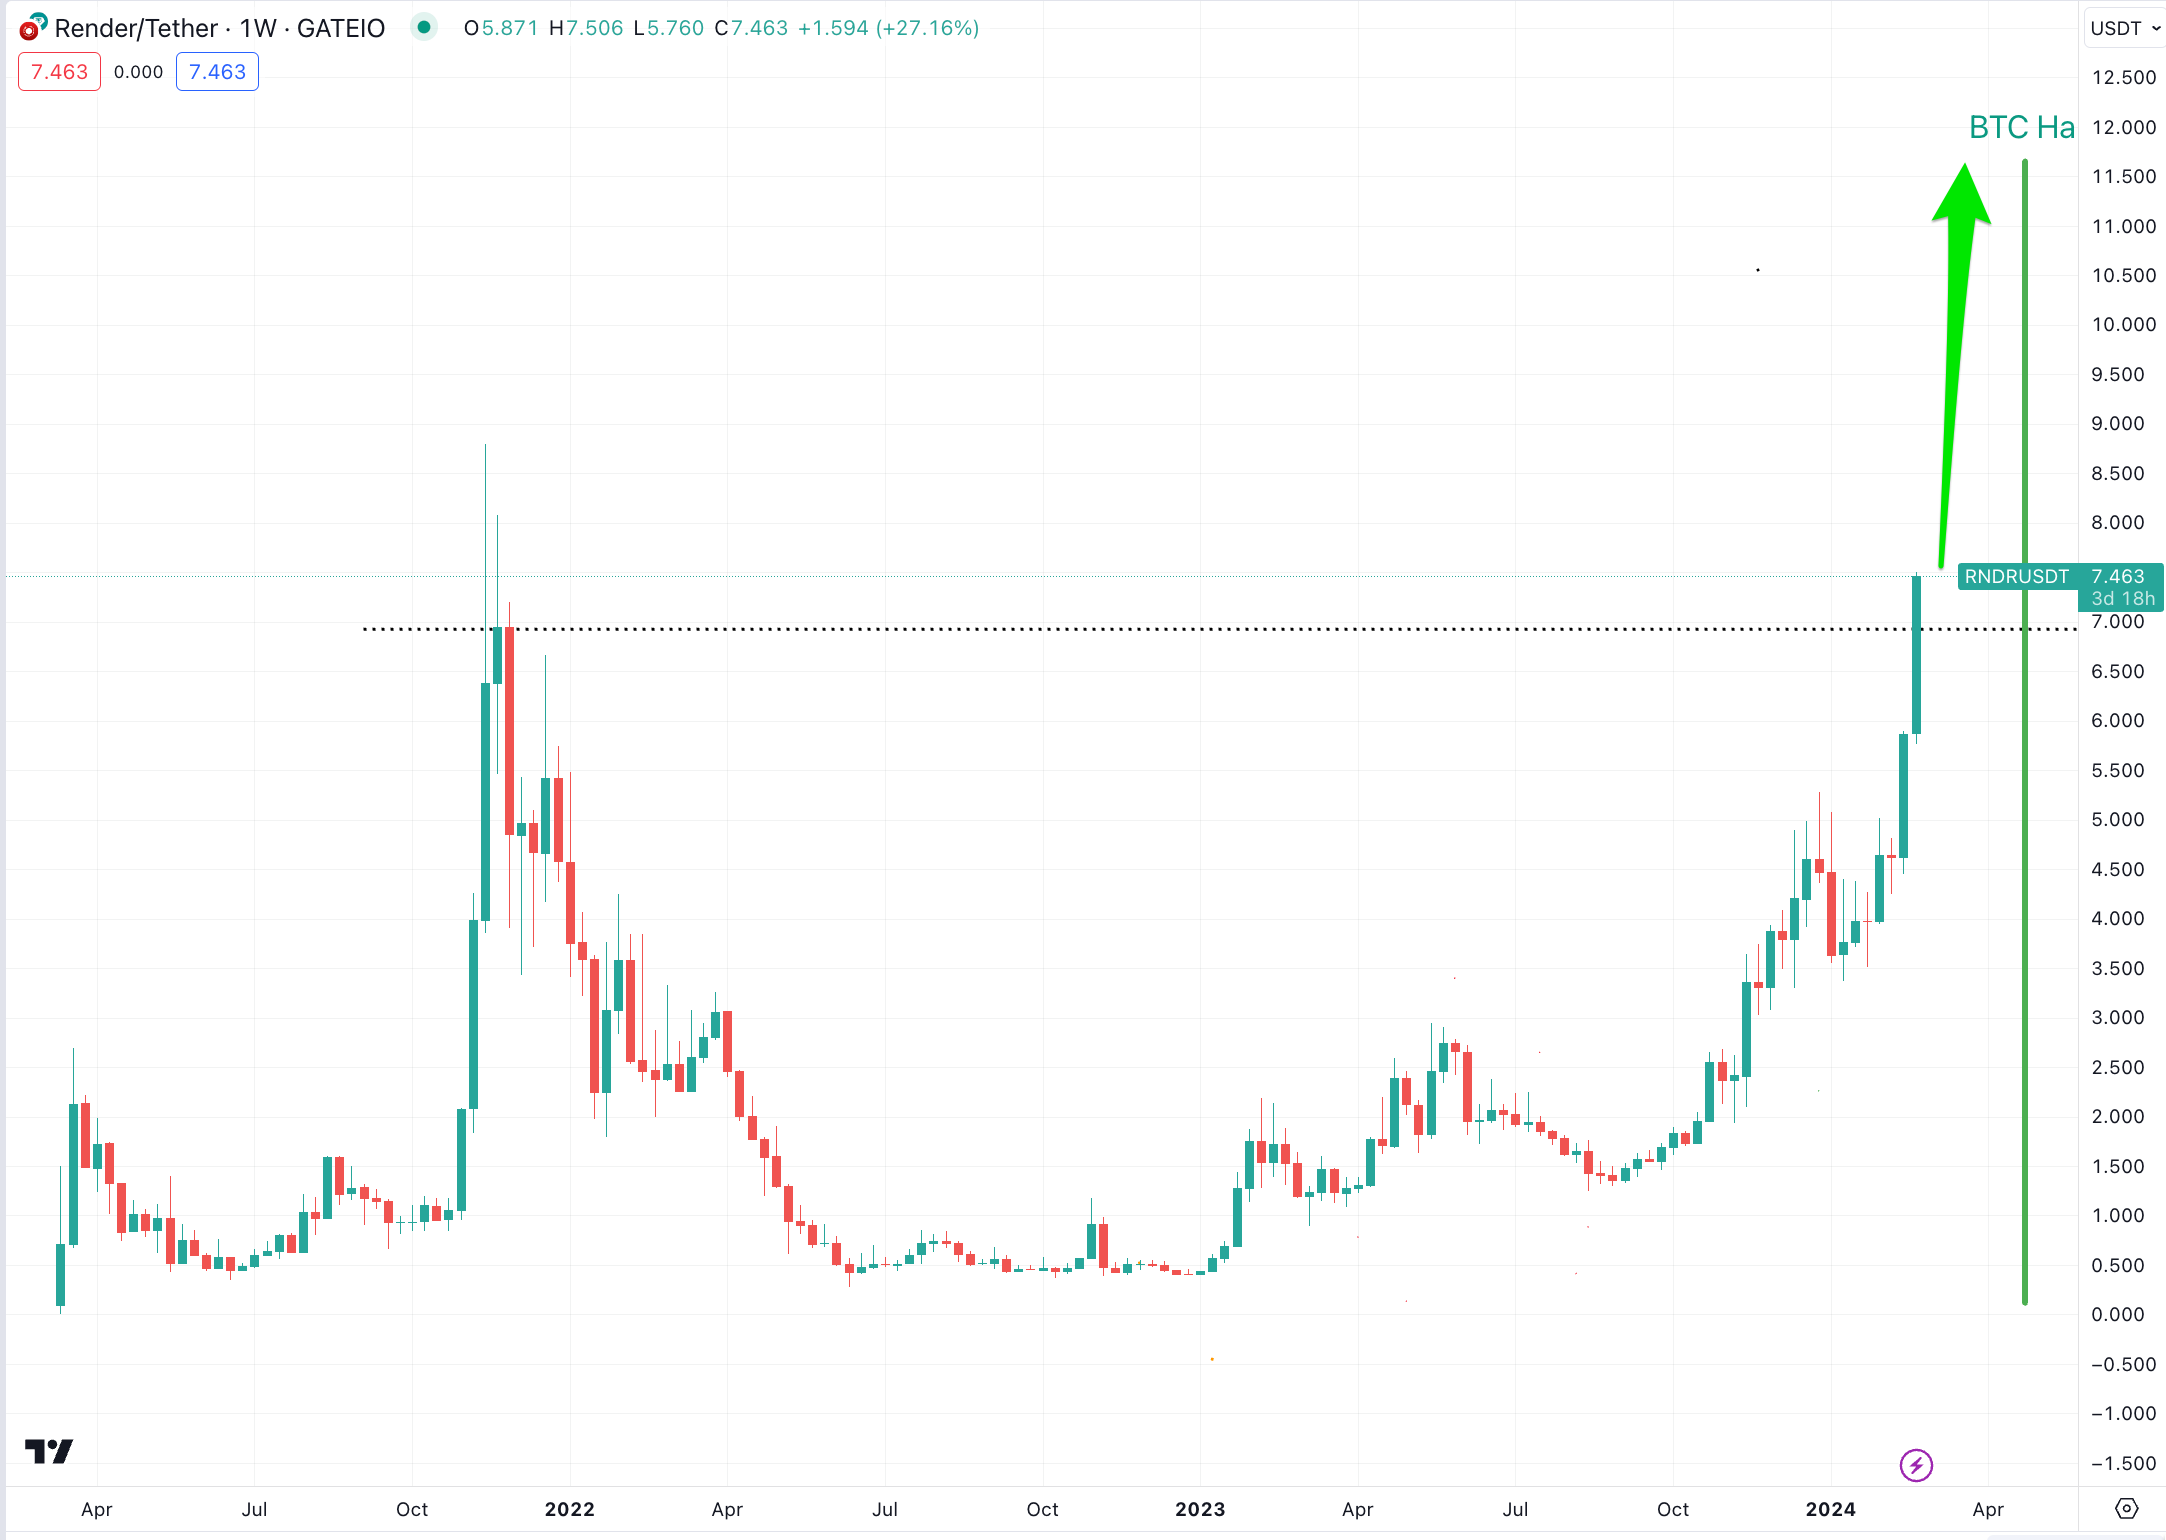
The weekly time frame technical analysis shows the RNDR price has increased quickly since the start of the year, creating six bullish daily candlesticks in seven days. The RNDR upward movement has become especially parabolic in the last two weeks, causing a breakout from an ascending resistance trend line.
Today, RNDR reached a high of $7.56, the highest since November 2021. More importantly, if the current weekly close holds, it would be the highest of all time. Cryptocurrency trader Rendosh1 suggests the RNDR price will reach double digits before halving.
Eliz883 noted that his spot positions are up 55% in the past few days and predicted a new RNDR all-time high price.
The weekly wave count is in alignment with these bullish predictions. Utilizing the Elliott Wave theory, technical analysts examine long-term price patterns and investor psychology that recur to determine the direction of a trend.
The most likely count suggests RNDR is in the fifth and final wave of the upward movement. Giving it the same length as the other two bullish waves will lead to a high of $8.50, 15% above the current price and only slightly below the all-time high of $8.80. However, if the fifth wave extends, RNDR can increase by 60% to the next resistance at $11.60.

Despite the bullish RNDR price prediction, a weekly close below $7 will mean the local top is in. Then, the RNDR price can fall 25% to the ascending resistance trend line at $5.50.
FET Moves Above $1
The price movement for FET is similar to that of RNDR. The price has created three successive bullish weekly candlesticks and broke out from its long-term range (white). If the current weekly close holds, it will be the highest ever. FET reached a high of $1.17 today, only slightly below the all-time high of $1.20.
The wave count for FET is even more bullish than that of RNDR. The most likely count suggests FET is in the third wave of a five-wave upward movement. Wave three has already had more than 1.61 times the length of wave one. So, the next likely resistance level is at $1.60, 43% above the current price.
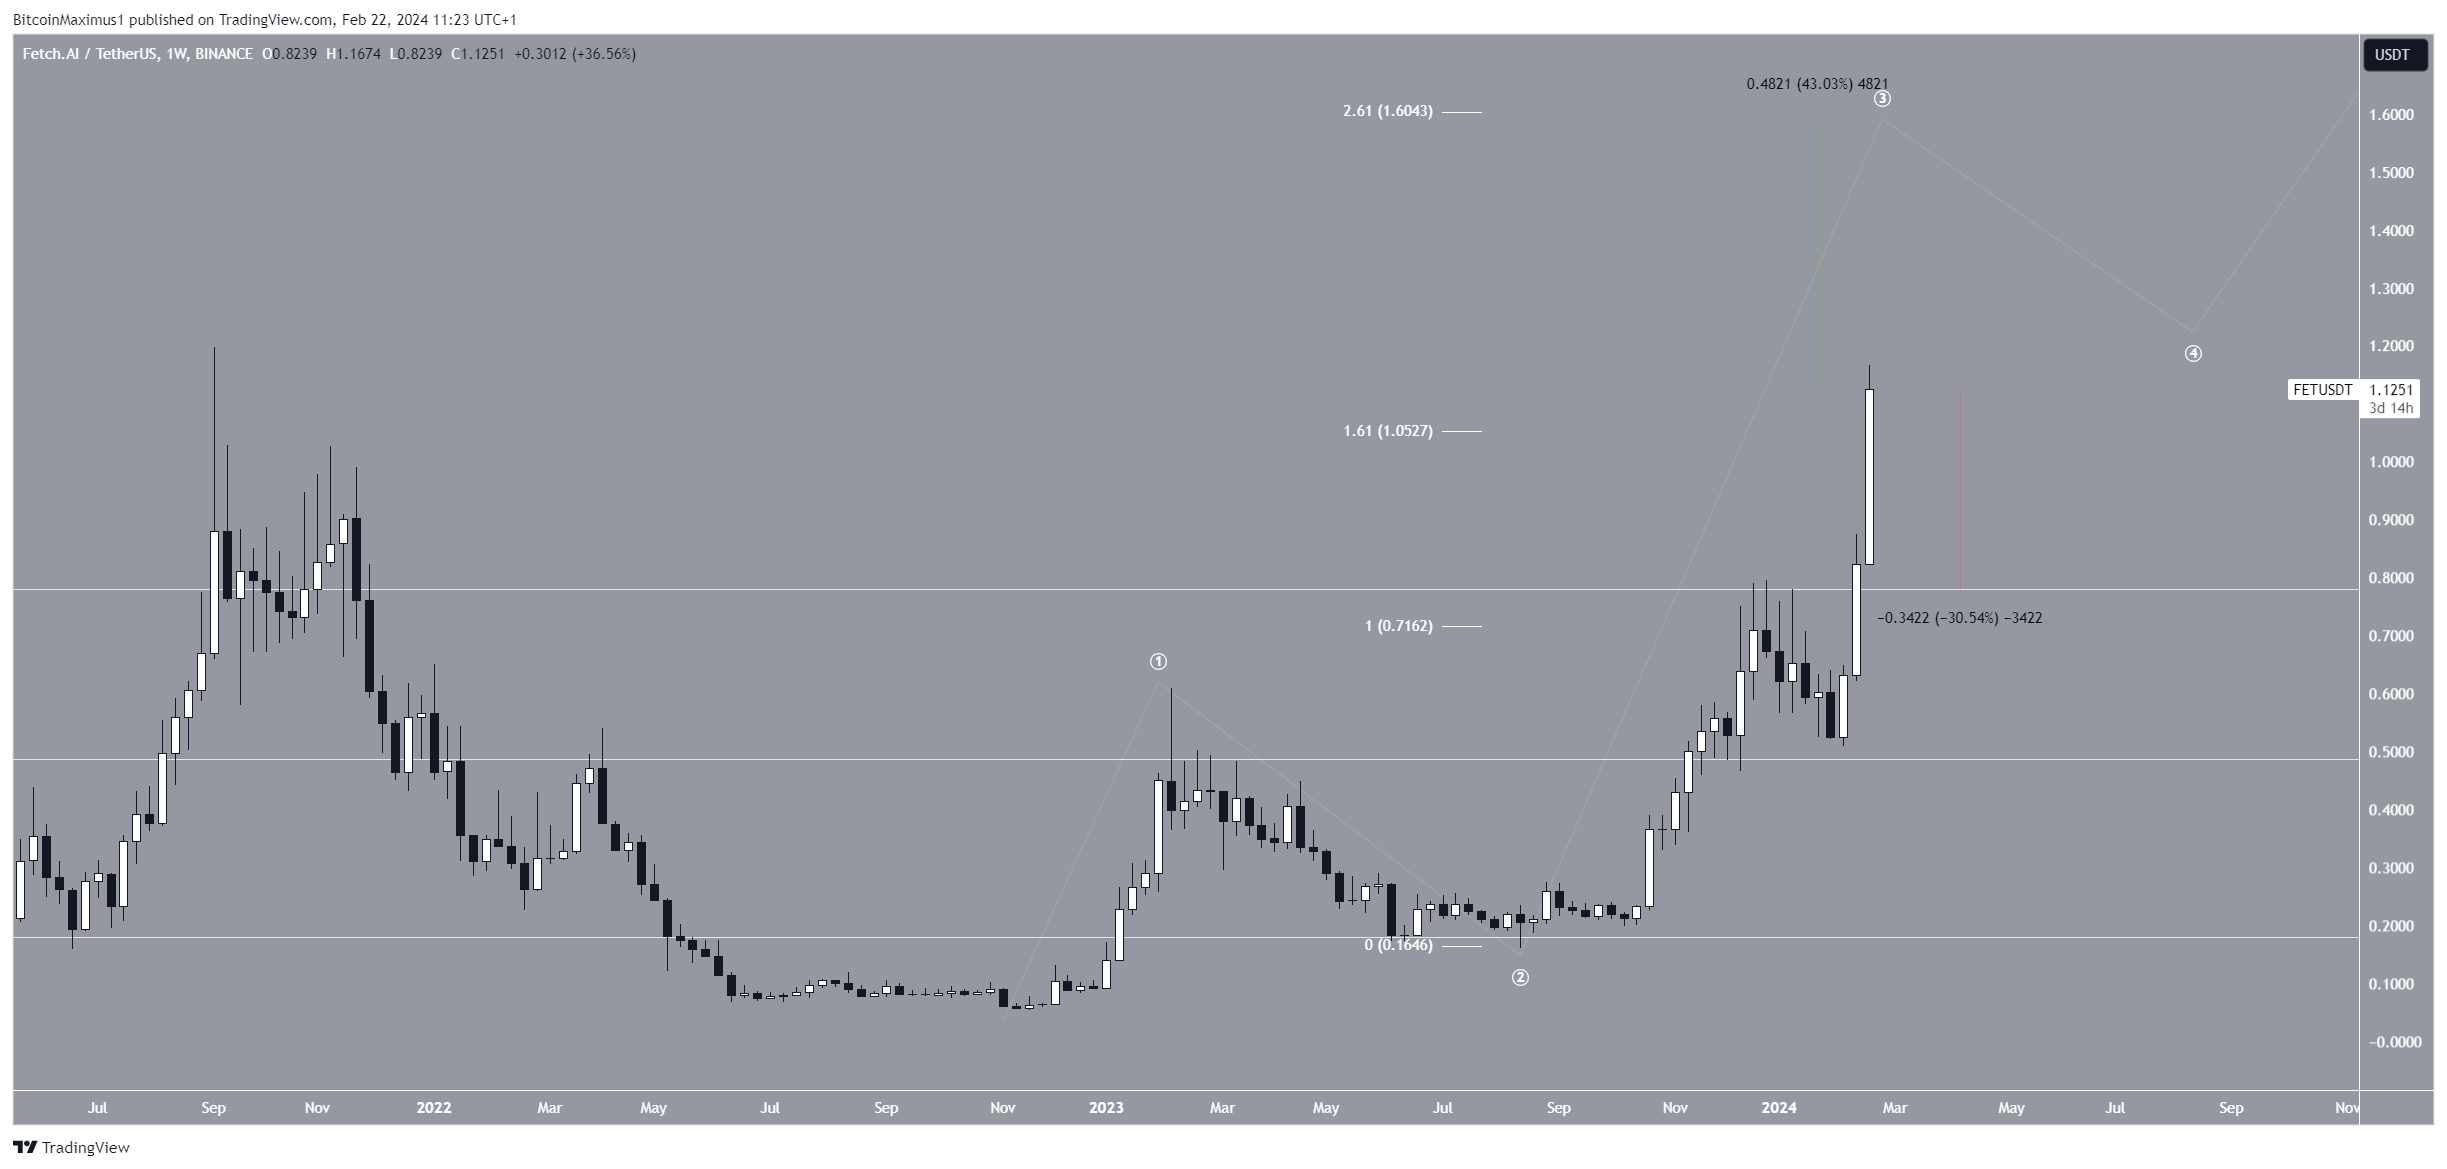
Despite the bullish FET price prediction, a close below the 1.61 Fib level at $1.05 will mean the local top is in. Then, the FET price can fall 30% to the top of the range at $0.80.
For BeInCrypto‘s latest crypto market analysis, click here.


