
The Litecoin (LTC) price rose 11% in three days, but is there more room for growth? Technical indicators suggest so. The coin’s RSI remains healthy, indicating there’s still room for bulls to push prices higher.
The number of short-term traders holding LTC has been steadily increasing, which could lead to more price volatility in the future. These short-term traders are known to jump in and out of positions quickly, which can cause prices to swing wildly.
Litecoin RSI Is Still Healthy Despite the Recent Price Growth
The Litecoin RSI has exhibited a notable uptick in the last two weeks, climbing from 60 to its current level of 67. The Relative Strength Index (RSI) serves as a valuable tool for gauging an asset’s relative strength and pinpointing potential turning points.
The RSI reflects the overall momentum behind price movements by comparing the magnitude of recent gains to recent losses. This indicator ranges from 0 to 100, with readings above 70 generally considered indicative of overbought conditions, potentially foreshadowing a price correction. Conversely, values below 30 suggest an oversold asset that might be primed for a rebound.
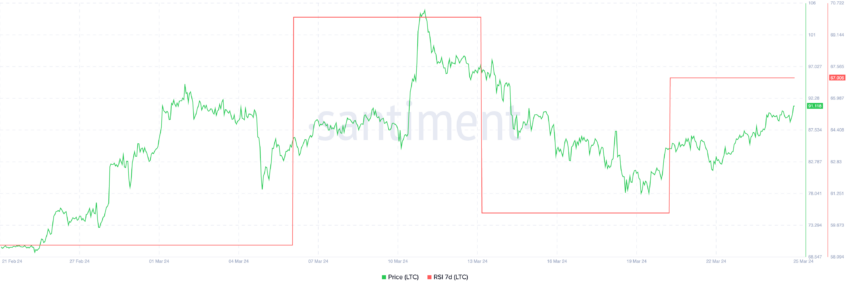
This recent rise in LTC RSI shows a surge in buying pressure, highlighting heightened investor interest and a more active market. While the current reading of 67 falls within a healthy zone, it’s important to note that it’s edging closer to the overbought territory.
Read More: Litecoin (LTC) Price Prediction 2024/2025/2030
This suggests that a period of consolidation or even a potential pullback could be on the horizon as some investors choose to take profits. However, it’s still too early to definitively predict a reversal, and the RSI itself doesn’t provide a guaranteed roadmap for future price movements.
Traders Are Still Growing
A deeper dive into LTC holder trends reveals a constant rise in short-term holders. These Traders, holding LTC for less than a month, grew from 429k to 529k between February 18 and March 25.
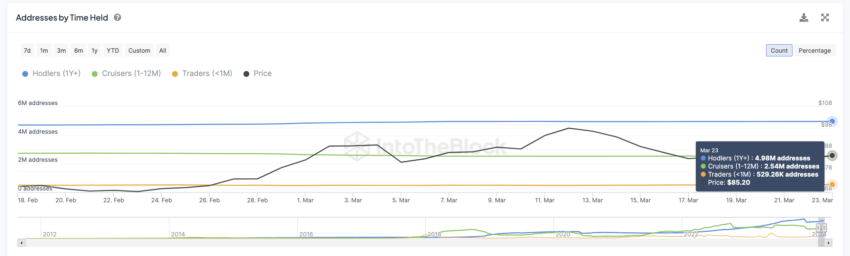
However, this surge in short-term ownership comes with a potential downside. Mid-term holders, or “cruisers” as they’re known (those holding for more than a month and less than a year), are showing signs of retreat. This demographic decreased from 2.74M to 2.54M in that same period.
This shift towards short-term traders and away from long-term believers could have a two-pronged impact on LTC price. Increased volatility is a likely consequence. Short-term traders are known for their rapid buying and selling, which can trigger price swings.
LTC Price Prediction: EMA Lines Just Formed a Golden Cross
LTC recent price surge could be just the beginning. The short-term EMA lines recently crossed above the long-term EMA lines. This is known as a golden cross. This is a bullish configuration, stating that a new bull run could start soon.
Exponential Moving Averages (EMAs) are technical analysis indicators used to understand price trends and potential turning points in an asset’s value. Unlike a Simple Moving Average (SMA) that assigns equal weight to all prices within a given timeframe, EMAs place greater emphasis on recent price points. This weighting system allows EMAs to react more swiftly to market changes and identify trends with greater accuracy.
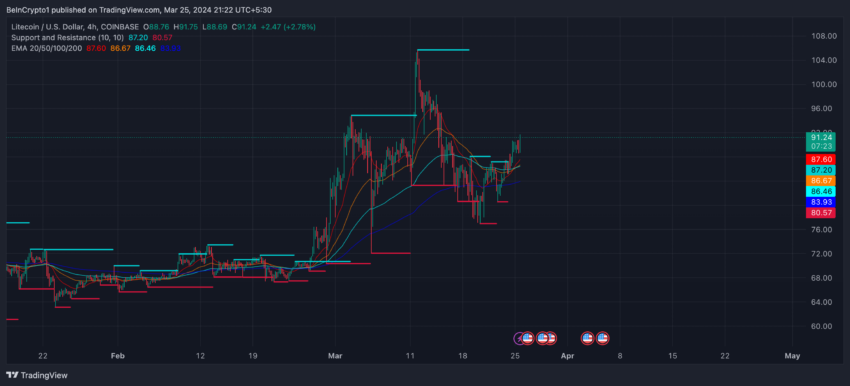
A bullish crossover occurs when a short-term EMA rises above a long-term EMA, while a bearish crossover is the opposite.
Read More: How To Buy Litecoin (LTC) and Everything You Need To Know
Given the influx of short-term traders and the favorable EMA positioning, a return to $105 for LTC wouldn’t be surprising. If that happens, LTC could keep rising and achieve $115 by next week. This would mark LTC’s highest price since April 2022. However, a breakdown of established support levels at $83 could trigger a further dip toward $72.


