The Solana price has undergone a significant correction from approximately $210 to about $116 over recent weeks. However, there is now potential for an upswing.
After our prior caution regarding a substantial correction in Solana when the price hovered around $190, the price has indeed declined by approximately 39%. Consequently, Solana has reached the correction target of around $130.
Solana’s Rough Patch: A 43.3% Decrease in Price
The correction in SOL’s price has been relatively moderate thus far, with the price dropping by over 43% this month.
Consequently, the histogram of the Moving Average Convergence/Divergence (MACD) is also beginning to trend lower in a bearish direction this month. However, the MACD lines maintain a bullish crossover in the monthly chart, while the Relative Strength Index (RSI) is gradually transitioning into neutral territory.
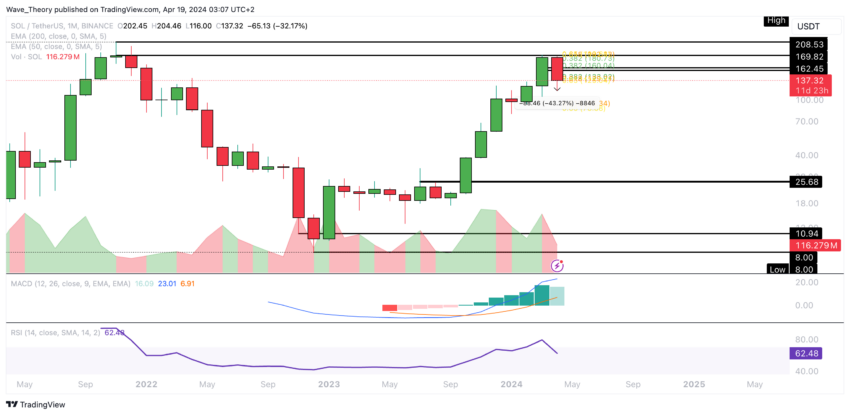
In summary, the bullish upward trend remains sustained as long as Solana maintains support above the golden ratio level at approximately $85.
Read More: 6 Best Platforms To Buy Solana (SOL) in 2024
Will Solana Hold Above $130? Analyzing Golden Ratio Support Impact
Significant Fibonacci support lies within the range of $125 to $130 for the SOL price. Maintaining above this range would signal a strong bullish sentiment.
Alternatively, the 50-week EMA at approximately $85 stands as an additional support level. Weekly chart indicators portray a bearish outlook, with the MACD histogram trending downward and the MACD lines nearing a bearish crossover.
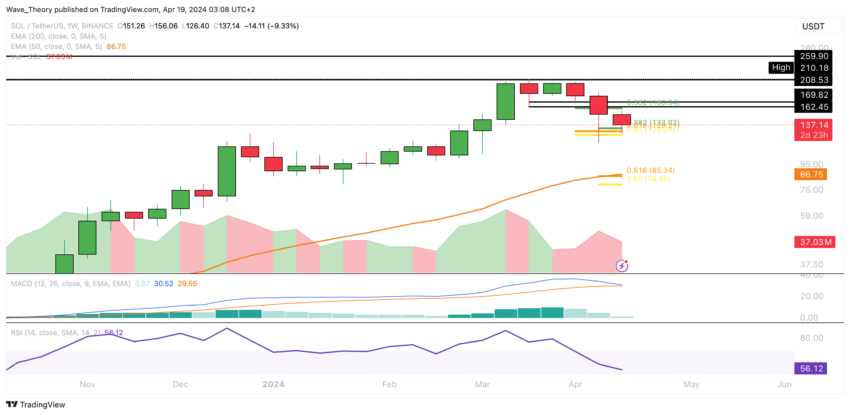
Meanwhile, the RSI remains in neutral territory.
Forecasting Solana: Key Fibonacci Resistance Levels to Watch
If Solana rebounds from the Golden Ratio support around $125, it could encounter significant resistance at the 50-day EMA around $156.6. Breaking through the golden ratio at $175 is necessary to halt the corrective movement, although horizontal resistance is present between $162.5 and $170.
Indicators offer mixed signals: the MACD histogram has shown bullish momentum for three days, and there’s a golden crossover in the EMAs, indicating a bullish trend in the short to medium term. However, the RSI remains neutral, and the MACD lines are currently bearishly crossed.
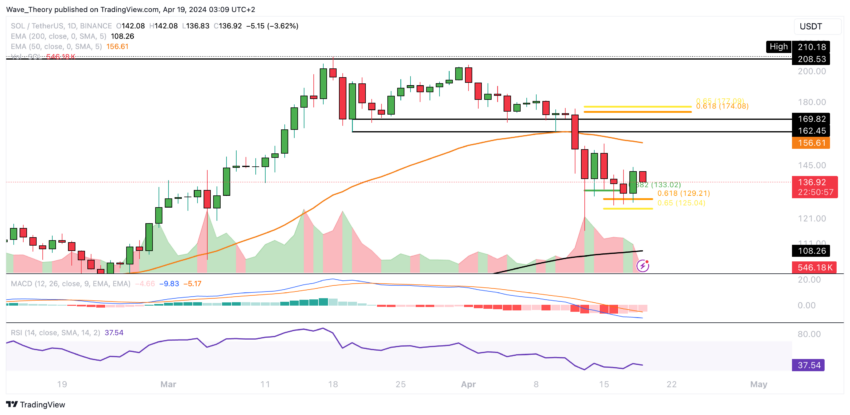
Should the current Fibonacci support falter, Solana may find support at the 200-day EMA near $108 before potentially correcting to the golden ratio at approximately $85.
Bearish Pattern: Death Cross Emerges on Solana’s 4-Hour Chart
The recent formation of a death cross in Solana’s 4-hour chart confirms a short-term bearish trend, indicating a potential downward movement toward the Golden Ratio support zone between $125 and $130.
Despite this, the MACD lines remain bullish, and the RSI hovers in neutral territory.

However, the MACD histogram is starting to show bearish momentum with a downward tick.
Solana vs. Bitcoin: Solana Hits Crucial Fibonacci Support Level
Against Bitcoin, Solana currently finds itself at Fibonacci support levels ranging between approximately 0.0021 BTC and 0.0023 BTC. This presents a potential opportunity for a bullish rebound.
Read More: Solana (SOL) Price Prediction 2024/2025/2030
However, it’s worth noting that Solana has been experiencing a downward trend over the past five weeks following a bearish rejection at the Golden Ratio resistance of around 0.003 BTC.
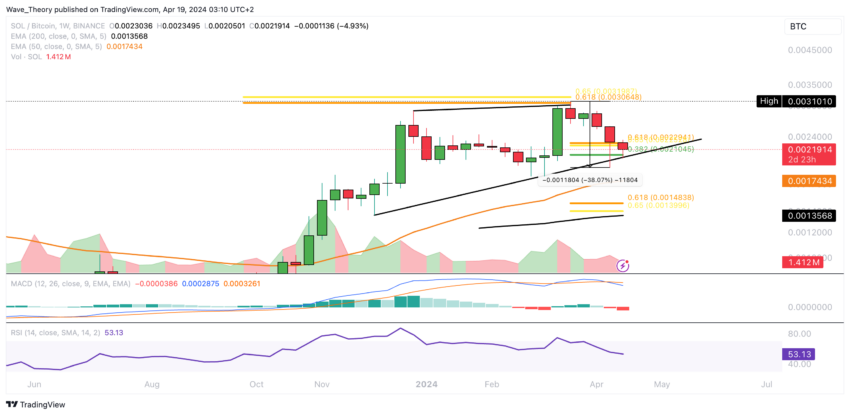
The MACD lines have crossed bearishly, accompanied by a downward trend in the MACD histogram, while the RSI remains in neutral territory.


