
Fantom (FTM) has seen a notable surge in the percentage of profitable holders, reaching 55%. A similar milestone was historically accompanied by a dramatic 858% increase in FTM price in less than four months. This suggests a potential upcoming price movement.
Recently, there has been a significant rise in the FTM supply held by traders, hinting at the possibility of future volatility. Moreover, the current positioning of FTM Exponential Moving Average (EMA) lines provides a neutral outlook. The short-term EMA lines are positioned above the long-term lines yet remain below the price line, indicating a mixed signal on the asset’s immediate direction.
FTM Profitable Holders Are at a Sweet Spot
Following the recent increase in FTM price, over 55% of FTM holders are now in profit, a situation not seen since August 2021 when more than 50% were profitable with FTM price under $1.
Following that period, FTM value escalated from $0.31 to $2.97 within three months, marking an extraordinary price growth of 858%. This historical precedent shows the potential for significant price movements following shifts in the percentage of profitable holders.
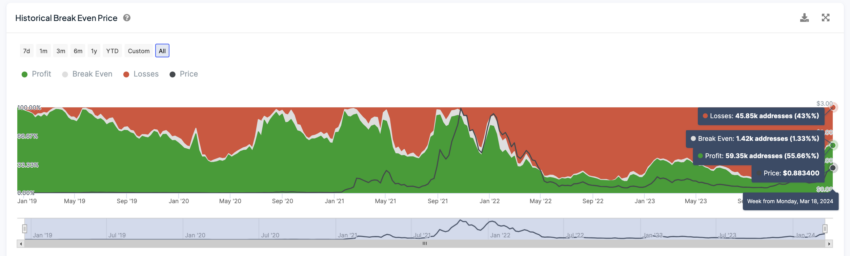
The historical break-even price metric refers to the average price at which current holders have purchased their tokens. Essentially, it’s the price point at which investors would neither make a profit nor incur a loss if they decided to sell their holdings at that price.
This could happen again if profitable holders decide to hold their FTM, expecting the price to pass $1, increasing their profits even more. Holders losing money at current price points could also hold their FTM, expecting the price to surge again.
Supply In The Hand Of Traders Is Increasing
From March 7 to March 18, the volume of FTM held by short-term traders—individuals who retain the asset for less than a month—soared from 95 million to an impressive 206 million. A significant 116% growth.
This shift in FTM supply distribution towards traders, as opposed to it being in the hands of medium and long-term investors, suggests a potential increase in short-term trading activities. Such a trend is often interpreted as a precursor to heightened price volatility for the asset in question.
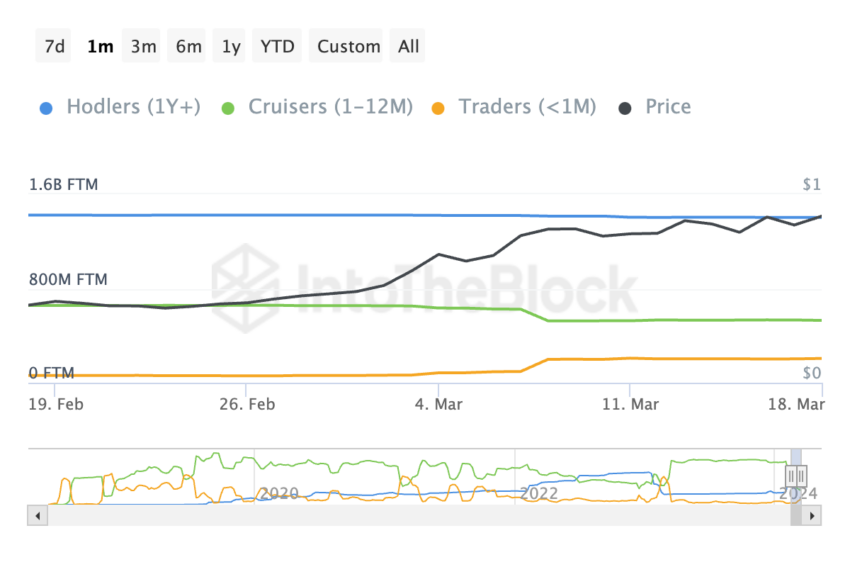
In a similar vein, examining the period from February 18 to March 4, there was noticeable growth in the trader-held supply of FTM, which climbed from 61 million to 83 million.
Concurrently, the price of FTM experienced a noteworthy surge, escalating from $0.41 to $0.68. This represents a 65% price increase, further illustrating the relationship between the supply dynamics of FTM among different investor classes and its market price.
FTM Price Prediction: Back To $1 Next?
FTM 4-hour chart analysis shows a key resistance at $0.98. If that one is broken, the FTM price could continue its growing trajectory, reaching values above $1 for the first time since April 13, 2022. However, it could also consolidate, as both short-term EMA lines are below its current price.
An EMA is a technical analysis tool used to smooth out price fluctuations and identify trends in the market. Unlike a Simple Moving Average (SMA) that gives equal weight to all data points within a chosen period, EMA places greater weight on recent prices. This makes it more responsive to current market movements.
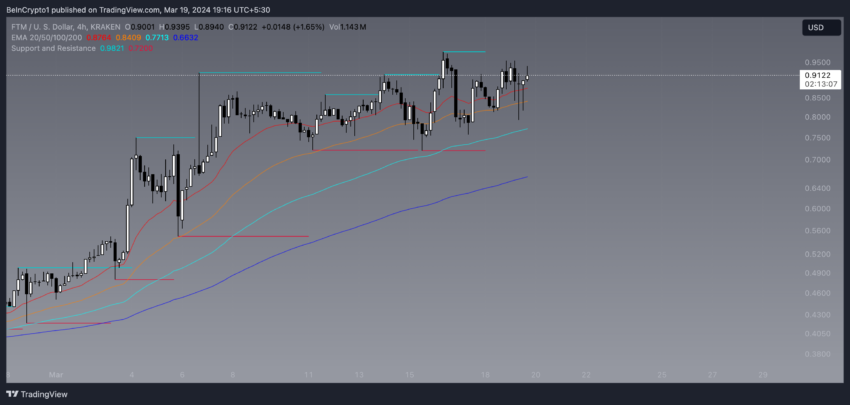
The crossover of short-term EMAs above long-term EMAs suggests a shift towards an uptrend in the short term. Recent price movements are pushing the short-term average upwards. However, since all EMAs are below the price line, the overall trend might still be down or consolidating. The price is currently trading higher than its recent and historical averages.
FTM price has strong support at $0.54. If that support isn’t strong enough, it could continue downwards to $0.48 or even $0.41, a potential 55% price correction.


