The price of Shiba Inu (SHIB) has surged by over 226% against BTC in just ten days, even as BTC reaches new all-time highs.
This significant increase reflects a broader trend seen in many other memecoins, suggesting a possible rise in the popularity and influence of memecoins in the current market landscape.
Shiba Inu Surges 267% in 10 Days: What’s Next?
The price of Shiba Inu Coin has surged by approximately 267% in the last ten days, reaching a significant Fibonacci resistance level at around $0.000037. If SHIB breaks this resistance, the next notable Fibonacci resistance will be around $0.000057.
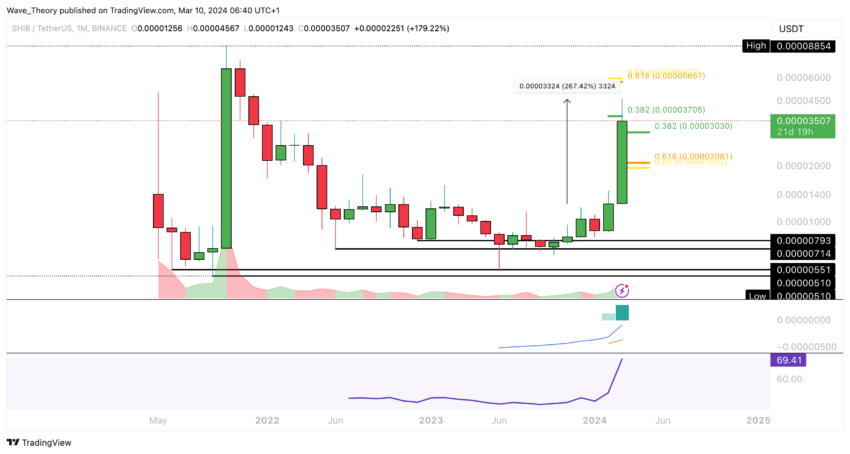
Breaking this level could signify a new bullish cycle for Shiba Inu, especially if the golden ratio is surpassed. Additionally, bullish signals are indicated by the Moving average convergence/divergence (MACD) histogram trending higher and the MACD lines remaining crossed bullishly, while the Relative Strength Index (RSI) is currently in neutral territory.
Correction Ahead for Shiba Inu?
In the weekly chart, the Shiba Inu price exhibits bullish tendencies. The MACD histogram has been trending higher since last week, accompanied by bullish crossovers in the MACD lines.
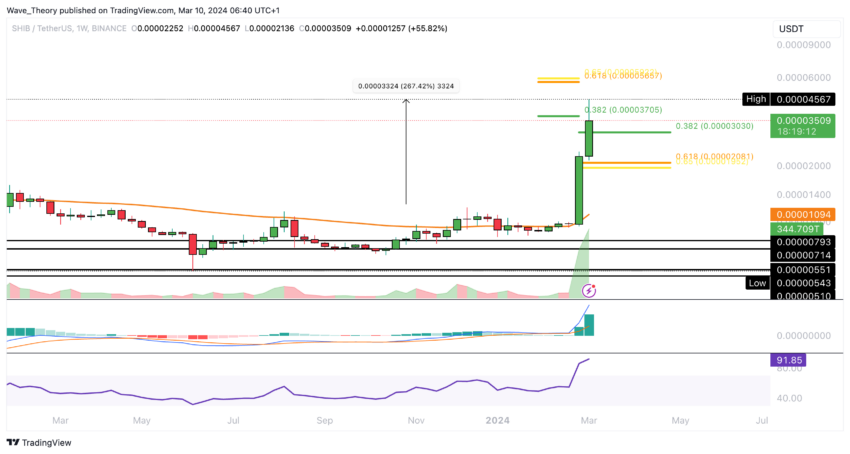
However, caution is advised as the RSI indicates heavily overbought conditions. Significant Fibonacci supports are anticipated around $0.00003 and $0.00002 in the event of a correction.
Shiba Inu Daily Chart Confirms Bullish Trend
In Shiba Inu’s daily chart, a golden crossover of the Exponential Moving Averages (EMAs) signals a bullish trend in the short to medium term. However, the MACD histogram has been declining, suggesting a bearish sentiment. Despite efforts to break the 0.382 Fib resistance around $0.000037, Shiba Inu may retreat to the .382 Fib support near $0.00003.
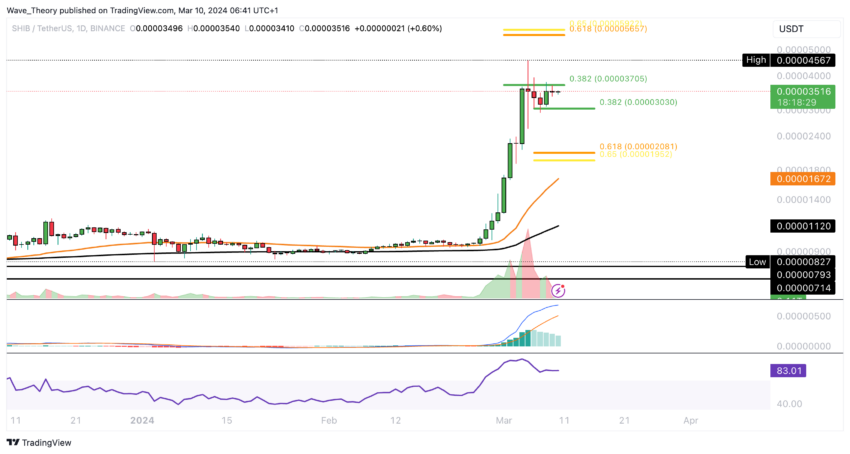
The MACD lines remain bullish, but caution is warranted as the RSI indicates heavy overbought conditions with no signs of bearish divergence
SHIB 4H Chart: Indicators Send Mixed Messages
In Shiba Inu’s 4H chart, the golden crossover of the EMAs confirms a bullish trend, but the MACD lines have already turned bearish, with the histogram fluctuating between bullish and bearish. The RSI is neutral, offering no clear signals. The decisive factor for SHIB’s direction lies in the fact that the 0.382 Fib level breaks first.
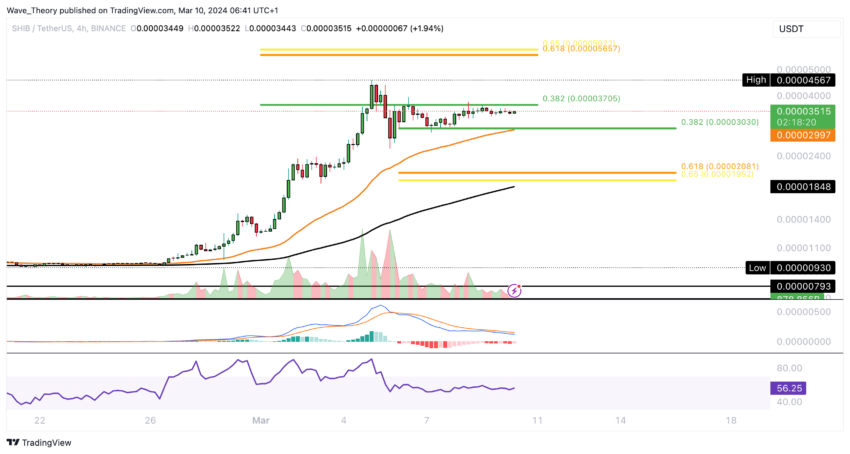
If $0.00003 support fails, supported by the 50-4H EMA, the next significant Fib support lies at $0.00002, backed by the 200-4H EMA. Alternatively, breaking the $0.000037 Fib resistance could lead SHIB to target $0.000057.
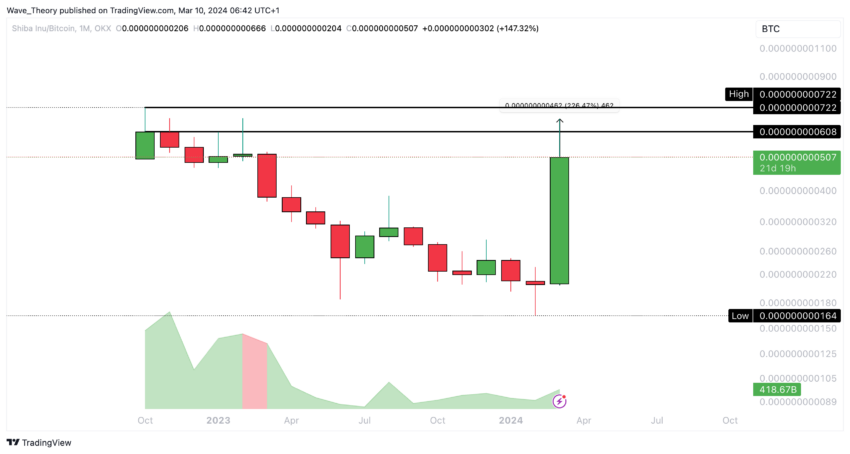
SHIB Records 226% Growth vs. BTC in 10 Day
Against BTC, Shiba Inu surged approximately 226% in a span of ten days. This surge brings SHIB to face substantial resistance ranging from around 0.0000000006 BTC to 0.000000000722 BTC.