The Solana (SOL) price has been rallying significantly, reaching a new multi-year high of $173. In doing so, the altcoin broke through multiple resistance levels.
However, from here on, will SOL note further increases and bring profits to its investors, or is this the end of the bullish road?
Solana Is Highly Rewardable
Solana’s price rise since the end of February has resulted in a 70% rally for the altcoin. The present market conditions suggest that SOL is not too late to qualify as an investment and can still offer significant profits.
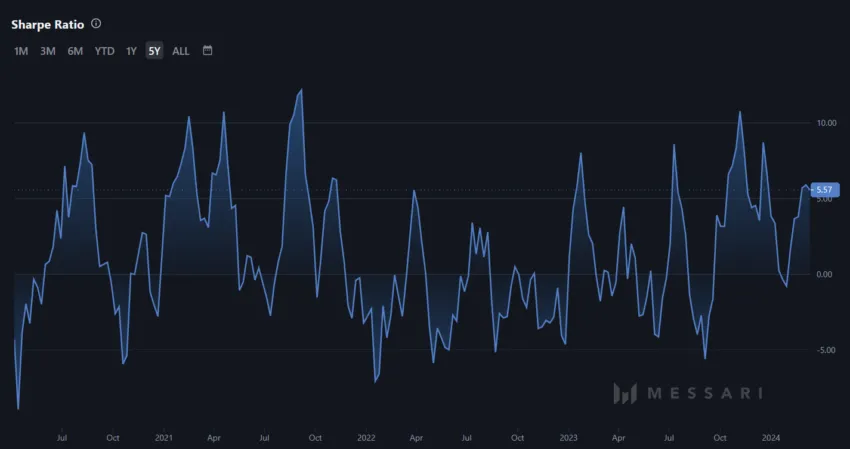
The Sharpe Ratio of the asset is currently at 5.37, the highest noted since December 2023. The Sharpe Ratio measures the risk-adjusted return of a cryptocurrency investment or portfolio. It compares the excess return of the cryptocurrency (above a risk-free rate) to its volatility.

A higher Sharpe Ratio suggests better risk-adjusted returns, indicating that the investment provides more return for the amount of risk taken. Nevertheless, the volatility of the market must also be taken into consideration in addition to the Sharpe Ratio.
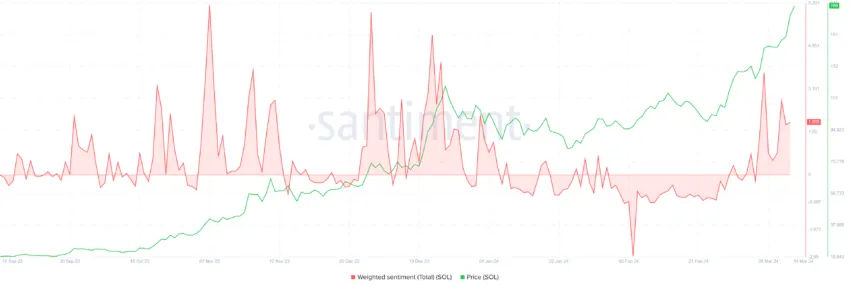
However, the momentum building in the market aligns with the rewards. Investors are optimistic about further gains, as seen on the chart. The weighted sentiment indicator spikes when the social volume is high, and the vast majority of the messages in it are simultaneously very positive.

Thus, with all indicators pointing towards an increase, the chances of the same seem high.
SOL Price Prediction: The Road to $200
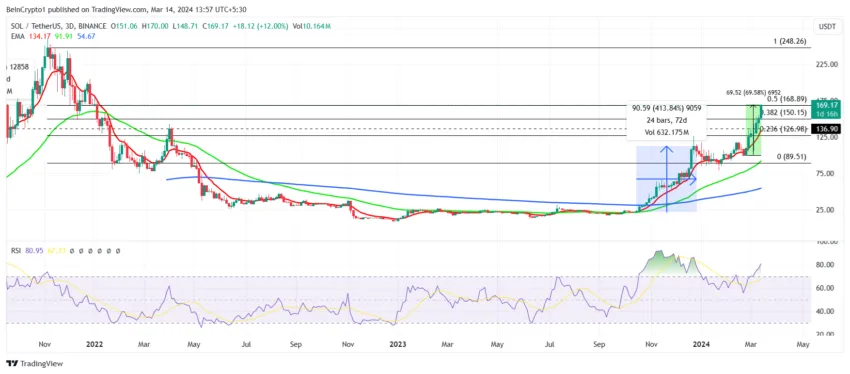
Solana price, trading at $170, is close to breaching the $200 mark, having already broken past such resistance levels. The altcoin is on the verge of breaching the 50% Fibonacci Retracement of $248 to $89. This level represents a crucial bullish flip toward the price action.
Once this line is flipped into a support floor, SOL would have the bullish momentum necessary to rally further.
However, if the breach fails, Solana’s price could move downwards and reverse the trend. As is the Relative Strength Index (RSI), it is in the overbought zone.

This indicator is a momentum oscillator that measures the speed and change of price movements. It indicates an asset’s overbought or oversold conditions. High RSI values suggest overbought conditions, while low values suggest oversold conditions, potentially signaling price reversals.
Since RSI is currently running high, investors need to practice caution as Solana is due for a price correction. If the “Ethereum-killer” fails to flip $168 into support, Sol would likely correct and fall to $150, invalidating the bullish thesis.


