
The Polkadot (DOT) price is witnessing bullish momentum building at the moment, which is likely signaling further growth for the altcoin.
While DOT is expected to go further, how much can it rise with the institutional investors in its corner?
Polkadot Preferred by Institutions
As it is well known that institutions are the drivers of the bull run this year, it becomes important for cryptocurrencies to have their favor. Polkadot has successfully achieved this since the beginning of the year.
Since the beginning of the year, DOT has noted higher inflows than the likes of its competitors, such as Litecoin. Not only this but since March started, Polkadot’s inflows surpassed that of major cryptocurrencies – Ripple and Cardano. Both these tokens stand to be an institutional favorite, but DOT has managed to defeat them both.
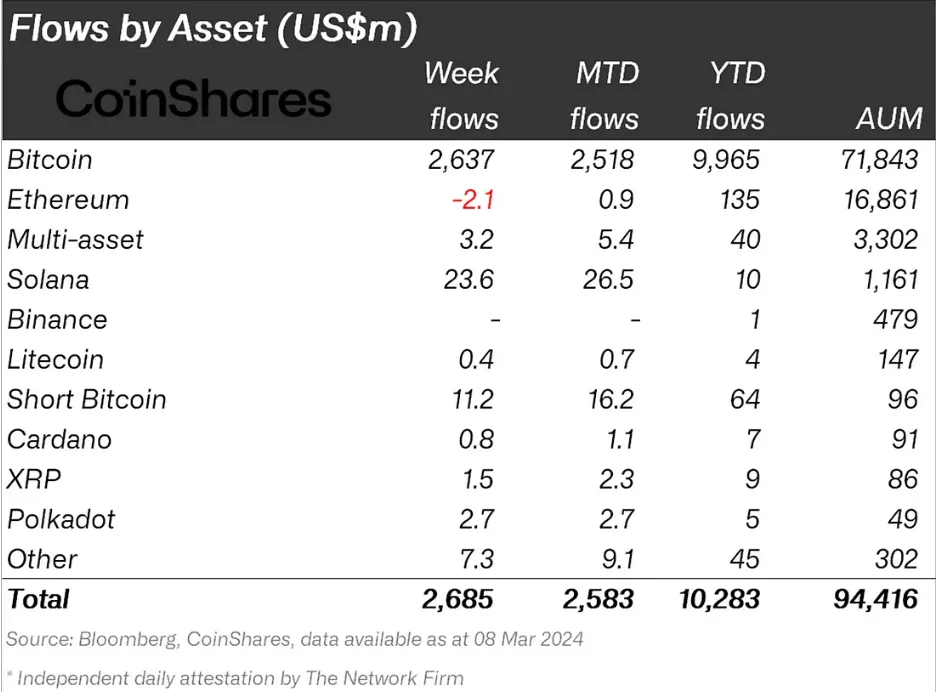
This proves that institutions are observing potential in the altcoin that even the investors may not have recognized yet. The same is evident from the fact that Polkadot believes that cryptocurrency is undervalued according to the price-to-sales (P/S) ratio.
The Price-to-Sales (P/S) ratio compares a company’s market capitalization (total market value) to its total sales revenue. It helps assess a company’s valuation relative to its revenue generation.
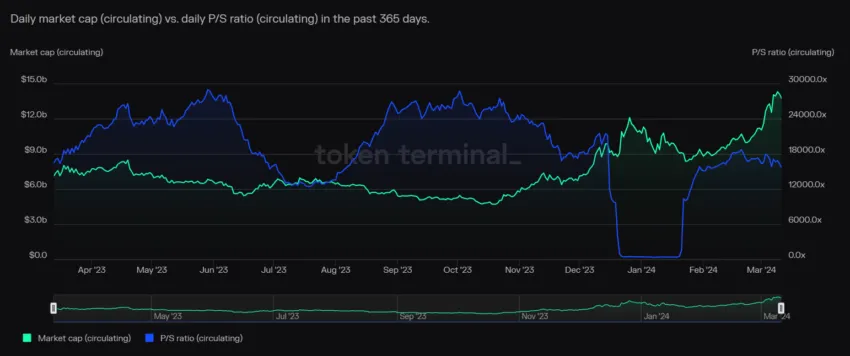
A lower P/S ratio may indicate a better value, while a higher ratio could suggest overvaluation. Such is the case with DOT, too, since its P/S ratio is far lower than it used to be on average historically.
DOT Price Prediction: Growth on the Horizon
Polkadot price has been observing a rounding bottom pattern over the past few weeks. Since the year started, this bullish reversal pattern took shape, breaching the neckline at the beginning of the month.
A rounding bottom pattern, seen in stock charts, suggests a reversal of a downtrend. It appears as a gradual decline followed by a gradual rise, forming a “U” shape. This pattern indicates a shift from selling pressure to buying interest.
It is also observed as a sign of potential price appreciation, anticipating the previous downtrend being exhausted. Confirmation often comes when the price breaks above the pattern’s neckline.
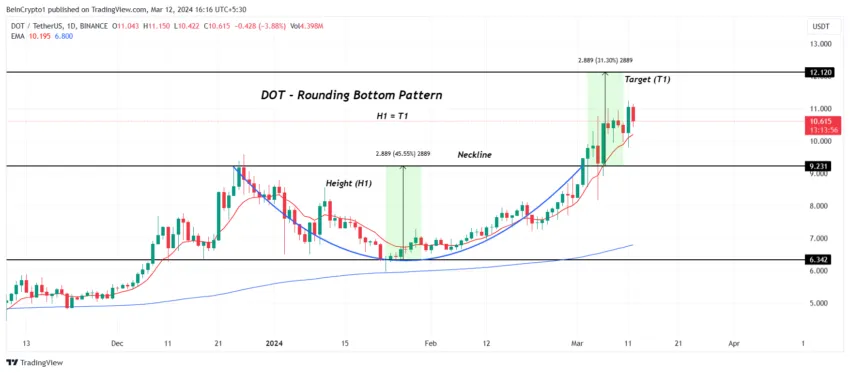
At $10.61, Polkadot’s price has already completed half the expected growth of 31.3%, inching closer to the target price of $12. If the market conditions support further increase, DOT might end up tagging this target, fulfilling the bullish pattern.
However, if DOT holders opt to sell their holdings mid-way or Polkadot price fails to cross the $11 mark, the rise may slow down. A fallback to $10 is likely in such a case. A further loss of momentum would send the altcoin to $9.20. This would invalidate the bullish thesis and extend the wait to validate the rounding bottom pattern.


