
The Shiba Inu (SHIB) price trades inside long- and short-term ascending parallel channel patterns.
SHIB made a breakout attempt on February 15 but failed to sustain the upward movement and fell afterward.
SHIB Trades in Corrective Pattern
The technical analysis of the daily time frame shows that the SHIB price has traded inside an ascending parallel channel since June 2023. The upward movement culminated with a high of $0.0000120 on December 17. Afterward, SHIB started to fall under a descending resistance trend line, reaching the lower portion of the channel.
However, SHIB regained its footing in February 2024 and broke out from the descending resistance trend line. Despite the breakout, it did not move above the middle of the channel. Rather, it was rejected (red icon).

The daily Relative Strength Index (RSI) gives an undetermined reading. Market traders use the RSI as a momentum indicator to identify overbought or oversold conditions and to decide whether to accumulate or sell an asset.
Readings above 50 and an upward trend indicate that bulls still have an advantage, whereas readings below 50 suggest the opposite. The indicator is at 50 (green circle), showing an undetermined trend.
SHIB Price Prediction: Is More Downside Expected?
The technical analysis of the six-hour time frame suggests that more downside is likely because of the price action and RSI readings. The price action shows that SHIB also trades in the lower portion of a short-term ascending parallel channel. It has fallen since it was rejected by its resistance trend line on February 16 (red icon).
During this descent, the six-hour RSI also fell below 50 (red circle), a sign of a bearish trend.
A breakdown from the channel will confirm the downward movement. Then, SHIB can fall 17% to the channel’s ascending support trend line at $0.0000080.
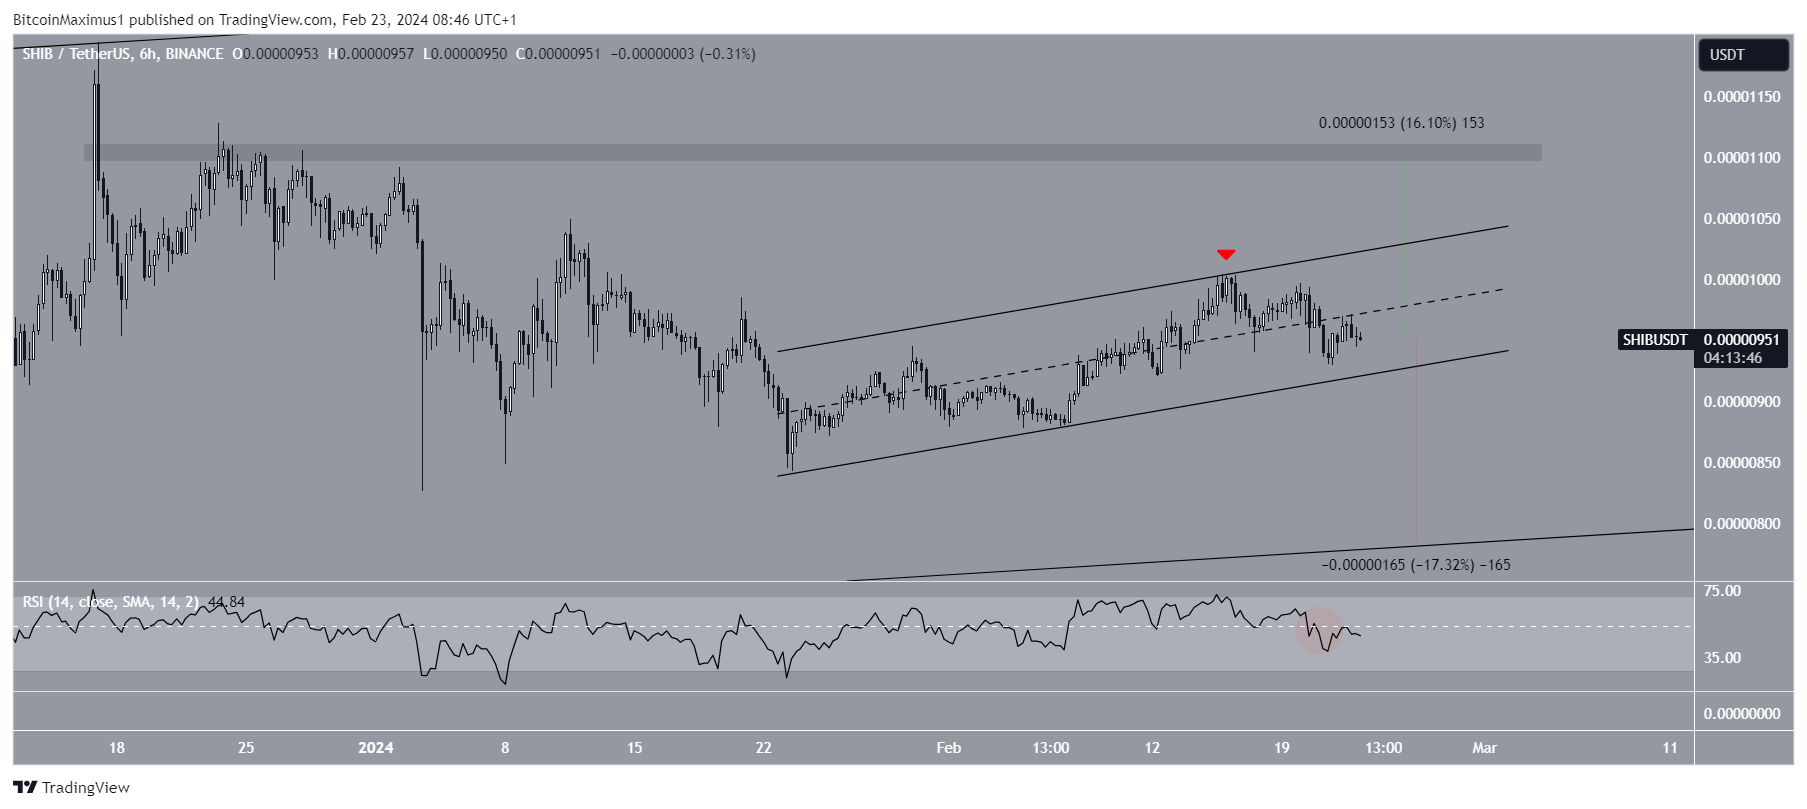
Despite the bearish SHIB price prediction, breaking out from the ascending parallel channel will mean the local bottom is in. Then, the SHIB price can increase 16% to the next resistance at $0.0000110.
For BeInCrypto‘s latest crypto market analysis, click here.


