The XRP price started February on a bullish note but has fallen since February 16, losing a significant portion of its previous gains.
The XRP price also broke down from an ascending support trend line that had existed since the beginning of the month.
XRP Does Not Sustain an Increase
The technical analysis from the daily time frame shows the XRP price has fallen inside a descending parallel channel since November 2023. Such channels often contain corrective movements.
The XRP price reached the channel’s support line on January 31, 2024, and bounced (green icon). The movement took it above the channel’s midline. However, the price was rejected by a horizontal resistance area and has returned to the channel’s midline.

The daily Relative Strength Index (RSI) leans bearish. When evaluating market conditions, traders use the RSI as a momentum indicator to determine whether a market is overbought or oversold and whether to accumulate or sell an asset. If the RSI reading is above 50 and the trend is upward, bulls still have an advantage, but if the reading is below 50, the opposite is true. The indicator fell below 50 (red circle), signifying a bearish trend.
XRP Price Prediction: Will $0.50 Hold?
The technical analysis of the short-term six-hour time frame gives a bearish outlook, suggesting the XRP price will fall in the lower portion of the long-term channel mentioned above. This is because of the price action and RSI readings.
The price action shows that XRP broke down from an ascending support trend line that had existed since the start of the month. Such breakdowns signify the previous upward movement has ended.
The six-hour RSI has fallen below 50 (red icon), legitimizing the breakdown and suggesting the upward movement is complete. If the XRP downward movement continues, the price can fall by another 7% and reach the closest support at $0.50.
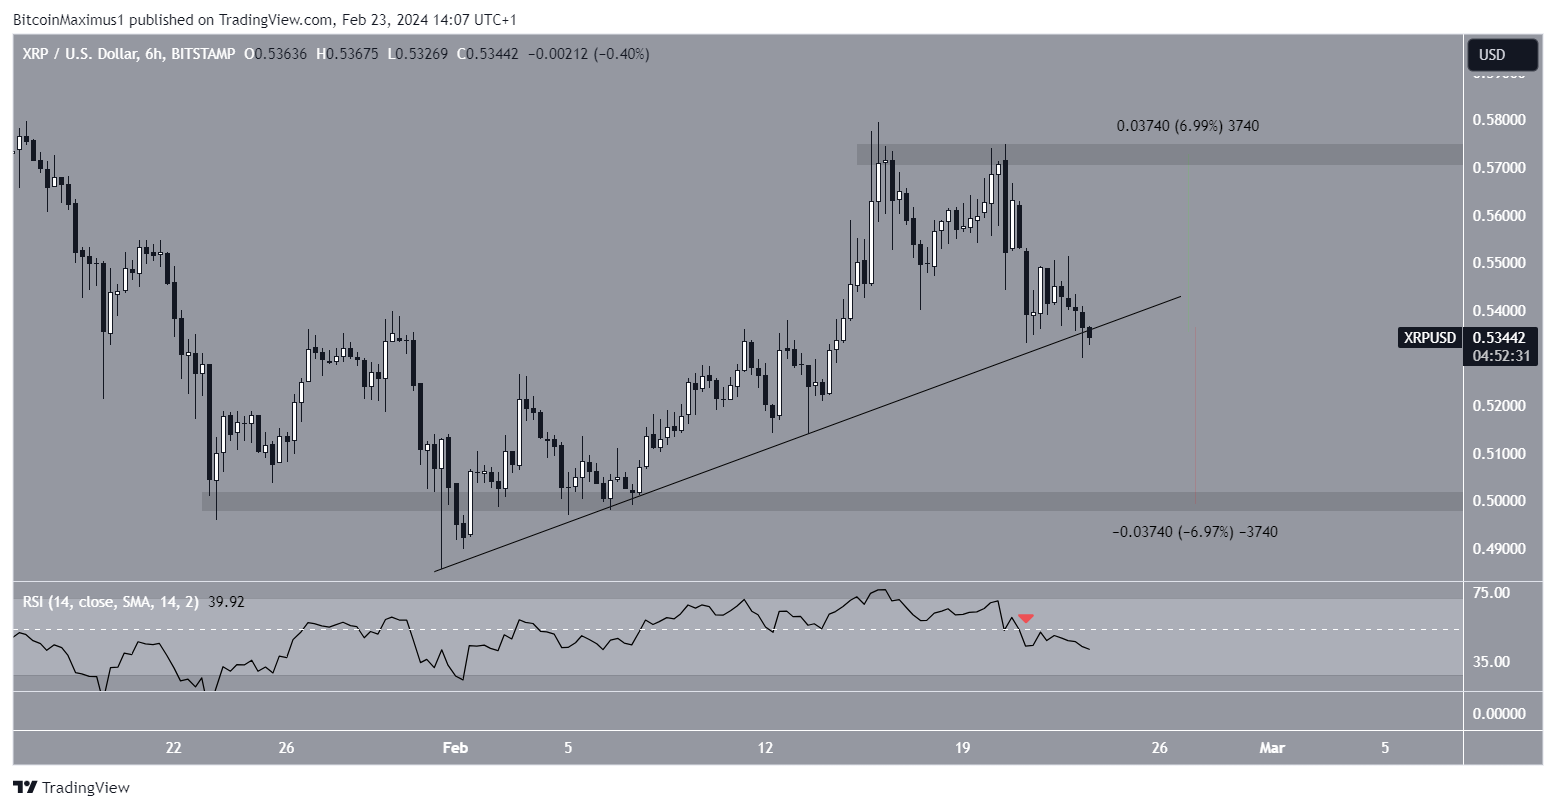
Despite this bearish XRP price prediction, reclaiming the ascending support trend line will invalidate the breakdown. Then, the XRP price can increase by 7% to the closest resistance at $0.57.
For BeInCrypto‘s latest crypto market analysis, click here.


