
While ADA’s market cap suggests a solidifying presence, its price movement in relation to historical highs and lows paints a broader picture of market sentiment and potential future trends.
This article will dissect the numbers, chart patterns, and market signals to forecast where Cardano’s price may be headed.
Cardano Just Reached Its Highest Price in 22 Months
Cardano (ADA) has recently witnessed a substantial price boost. The current trading price of $0.780 signifies a 10% rise and a remarkable recovery from its cycle low of $0.238.
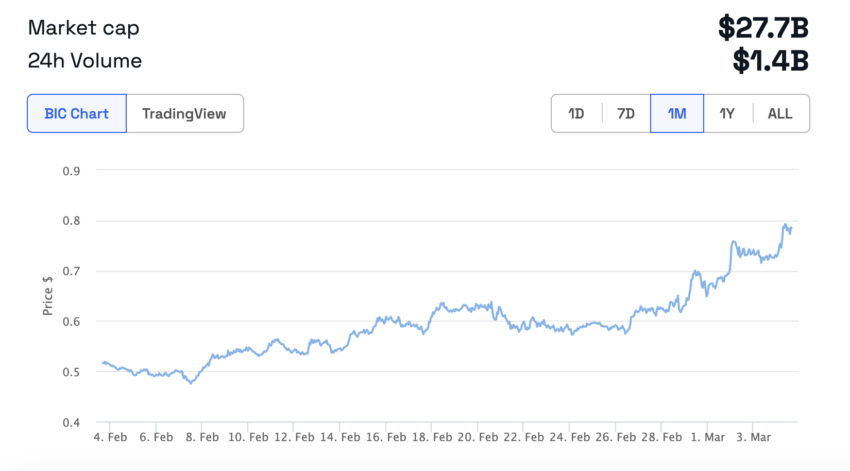
ADA last reached that price level on April 25, 2022. Even with bearish predictions about its price, Cardano has been resilient in the last few weeks, with a 53.71% growth in its price in the last month.
Cardano Is Still Way Below Its All-Time High
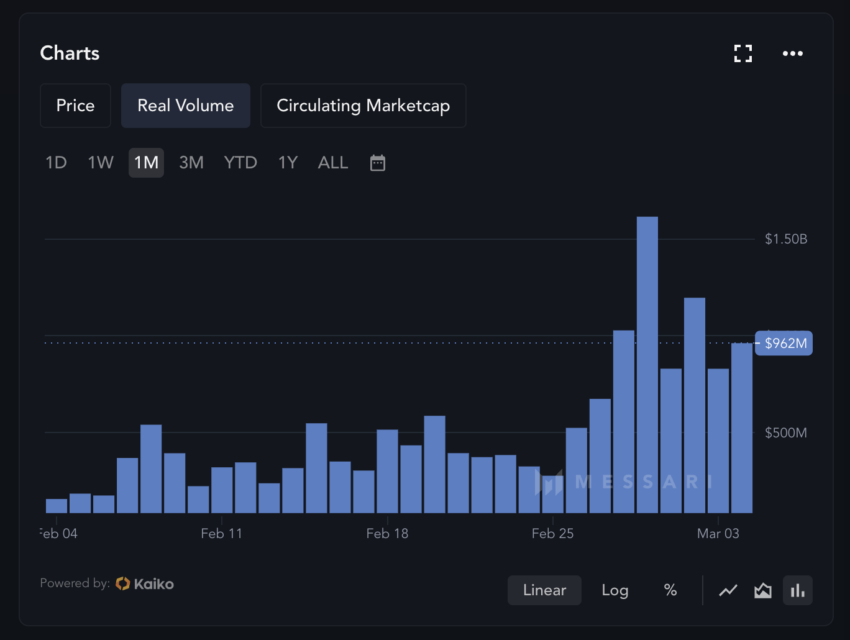
Cardano’s market valuation is now at $27.69 billion, and its 24-hour trading volume is around $1.20 billion. Its trading volume has been growing consistently in the last few weeks.
In other cycles, a growing uptrend around volume led to price increases for ADA.
Despite its recent price growth, ADA is still around 75% down from its all-time high of $3.10, which it hit on September 2, 2021. Which could indicate much room for growth in the next few months.
Cardano Sees Solid Support at $ 0.75
The In/Out of the Money Around Price (IOMAP) chart is a critical tool for understanding investor sentiment and potential price support levels. For ADA, the fact that 110.16K addresses are ‘In the Money’ within the $0.66 to $0.78 price range suggests a strong foundation of support, as many investors hold ADA at a profit in this interval.
This information is important because it indicates that selling pressure may decrease in this price range, potentially leading to stability or upward momentum for ADA’s price as investors are less likely to sell at a loss.
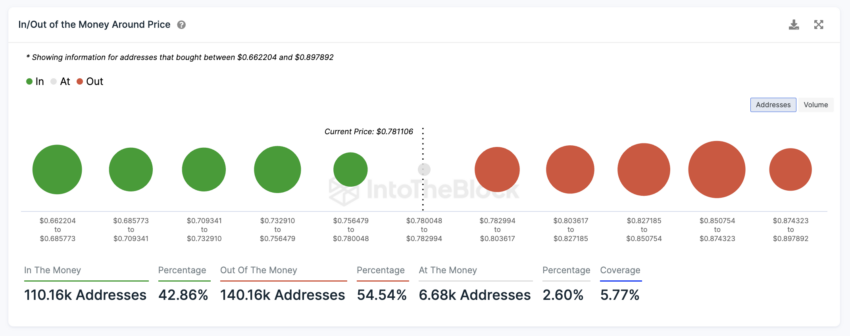
Conversely, ADA faces potential resistance ahead, with 140.16K addresses ‘Out of the Money,’ having bought in at higher price points up to $0.89. This creates a delicate balance that could dictate ADA’s short-term price trajectory.
Price Prediction: Can ADA Clear $0.80?
A breakout above the $0.785 resistance is essential for ADA’s price to sustain its growth. Such a movement would signal strength and could attract further buying pressure. Conversely, a dip below the support level of $0.777 might indicate a bearish turn, potentially leading to a retest of lower support zones.
Considering the current technical setup and market dynamics, ADA could soon see the $0.80 resistance if the bullish sentiment persists. Market participants will likely hold out for ADA to reach $1 before seeing significant selling pressure.
However, should the support at $0.75 fail, the price may retreat towards the $0.70 level. Investors should watch the support and resistance levels closely, as a breakout or breakdown from these points could provide significant insights into ADA’s forthcoming price action.


