
The significant 26% drop in Cardano’s (ADA) price since last week raises important questions about its future price trajectory. The key consideration now is whether ADA will continue to decline or if a recovery is on the horizon.
Currently, Cardano is encountering substantial support, which could play a pivotal role in determining its next move. If this support level holds, it could serve as a foundation for a potential rebound or stabilization in price. However, if this support fails to sustain ADA’s price, further declines could be possible.
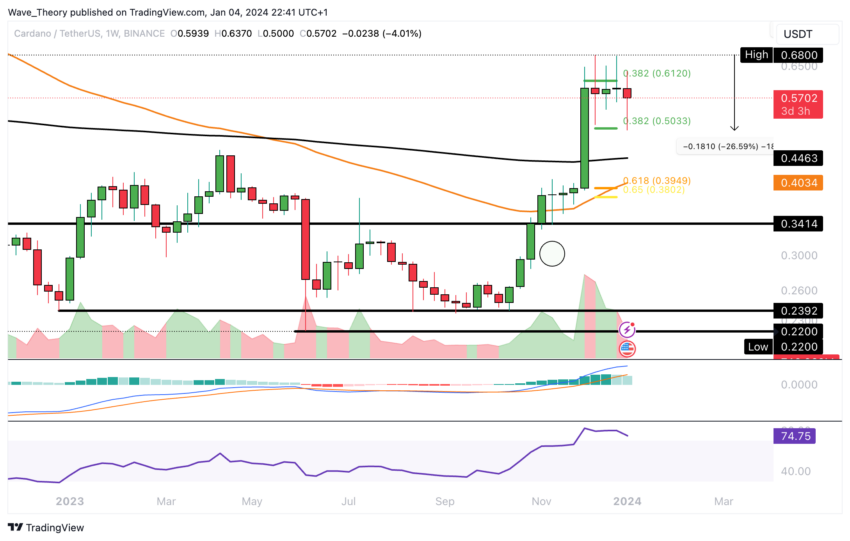
Cardano Price Tumbles 26.6% in the Past Week
Cardano has seen a 26.6% drop in price since last week but shows signs of a bullish bounce at the 0.382 Fibonacci (Fib) support level around $0.5. Despite this, the Moving Average Convergence Divergence (MACD) histogram is trending bearishly, while the MACD lines are still bullish.
The Relative Strength Index (RSI) is overbought on the weekly chart. If the $0.5 support level fails, the next key Fib support is at around $0.39, where the 50-week EMA could provide additional support.
ADA’s Steep Decline: 19.2% Price Drop in Just One Day
After surpassing the 0.382 Fibonacci (Fib) resistance level at approximately $0.612, Cardano experienced a bearish rejection, with the price dropping about 19.2% just yesterday.
The bearish trend is further indicated by the MACD histogram, which has been trending downwards for several days, and the MACD lines are now in a bearish crossover. Meanwhile, the RSI is neutral, not indicating a strong directional trend.
Contrasting these bearish indicators, the Exponential Moving Averages (EMAs) display a golden crossover, suggesting that the trend remains bullish in the short to medium term.
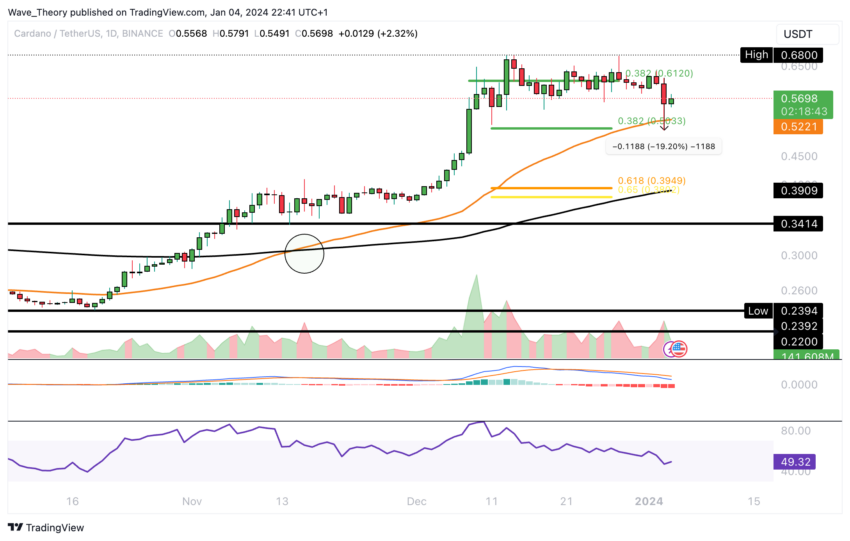
This mix of bearish MACD and RSI indicators with a bullish EMA crossover presents a complex market scenario for ADA, reflecting short-term volatility within an overall bullish context.
Cardano’s 4H Chart Shows Price at Crucial 200-4H EMA Support Level
In the 4-hour (4H) chart, the MACD histogram for Cardano is trending upwards bullishly, suggesting a potential bullish crossover of the MACD lines. Currently, ADA is finding support at the 200-4H Exponential Moving Average (EMA), approximately at $0.56.
Despite this potential bullish signal from the MACD, Cardano’s price trajectory continues its downward movement. This raises the possibility of a bearish break through the 200-4H EMA support.
The RSI is neutral, indicating no strong bullish or bearish trend. However, the EMAs exhibit a golden crossover, indicating that the trend remains bullish in the short term.
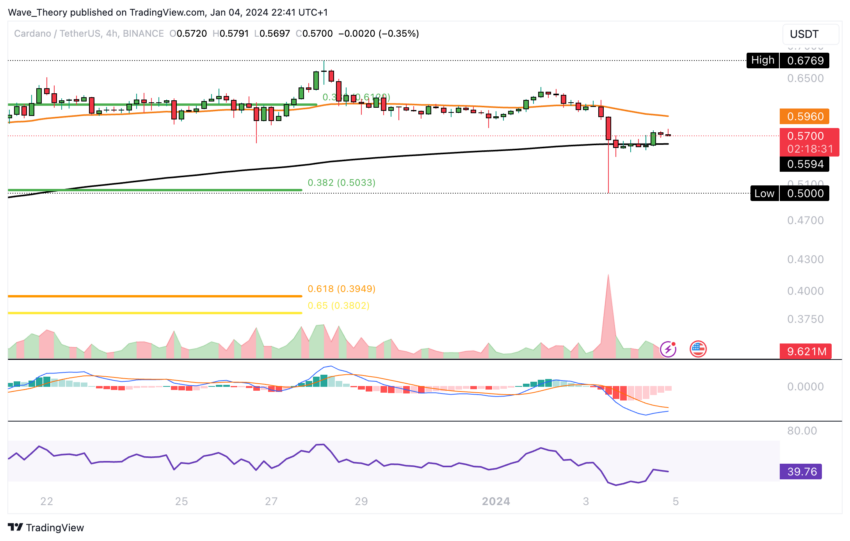
This combination of indicators suggests that while there is potential for continued bearish movement in the immediate term, the underlying short-term trend may still lean towards bullish.
Monthly Chart Analysis: Bearish Development in Cardano’s Candle Trend
In the monthly chart, despite the bullish indicators, Cardano’s price is currently trading below its opening price in January. However, the MACD lines maintain a bullish crossover, and the MACD histogram also shows an upward trend, indicating continued bullish sentiment.
The RSI in the monthly chart remains neutral, not providing definitive signals toward a bullish or bearish direction. This neutrality suggests a balanced market sentiment without strong directional bias.
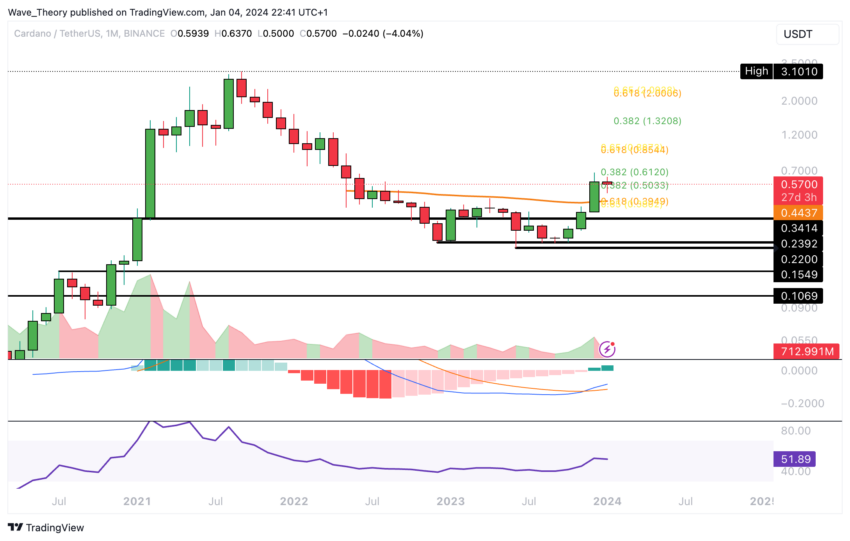
Should Cardano experience further corrections, a key level to watch is the 50-month EMA, which is around $0.444. This level could be a significant support, potentially stabilizing the price or even providing a basis for a rebound.
The interplay of these bullish indicators with current price movements below January’s opening price presents a nuanced view of Cardano’s market dynamics.
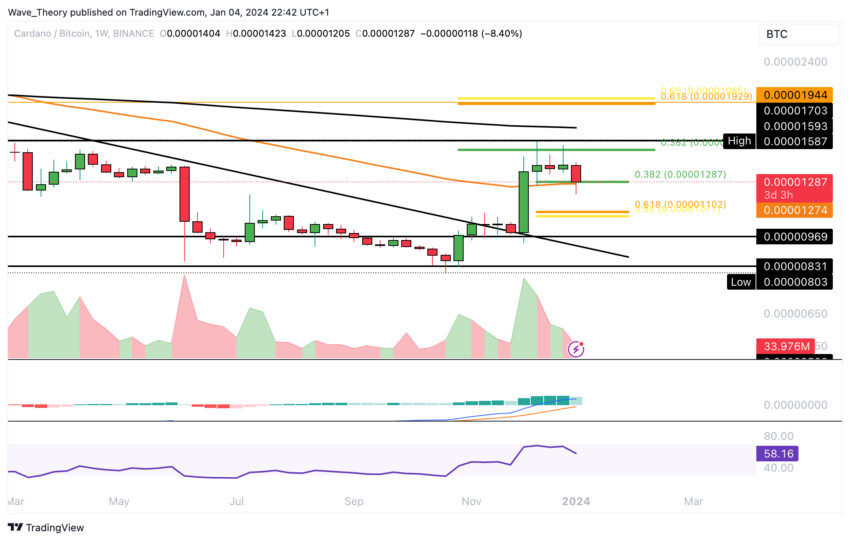
Cardano Gains Strong Support in Its Price Against Bitcoin
In its trading against Bitcoin (BTC), ADA is currently finding notable support at the convergence of the 0.382 Fibonacci (Fib) level and the 50-week EMA, around 0.00001275 BTC. If this support level fails, the next significant Fib support is expected at around 0.000011 BTC.
The MACD lines in this pairing are still in a bullish crossover, indicating potential bullish momentum. However, the MACD histogram is beginning to trend downwards in a bearish manner this week, suggesting a shift in momentum.
On the resistance front, Cardano faces a significant barrier at the 0.382 Fib level, around 0.0000152 BTC, a level where it has previously faced bearish rejections.
The RSI remains in a neutral zone, not providing clear bullish or bearish indications at the moment. Should ADA break below the golden ratio support level at around 0.000011 BTC, substantial support may not be found until the range of approximately 0.000008 BTC to 0.0000097 BTC.
This scenario outlines the potential support and resistance levels that could influence ADA’s future price movements against BTC.


