
Fantom (FTM) price has been consolidating for some time now and could continue. This is because the altcoin has not seen any strong directional bias in weeks.
However, a buy signal currently appears on the on-chain metrics, which could help FTM escape consolidation.
Buy Singlas Pop Up for Fantom
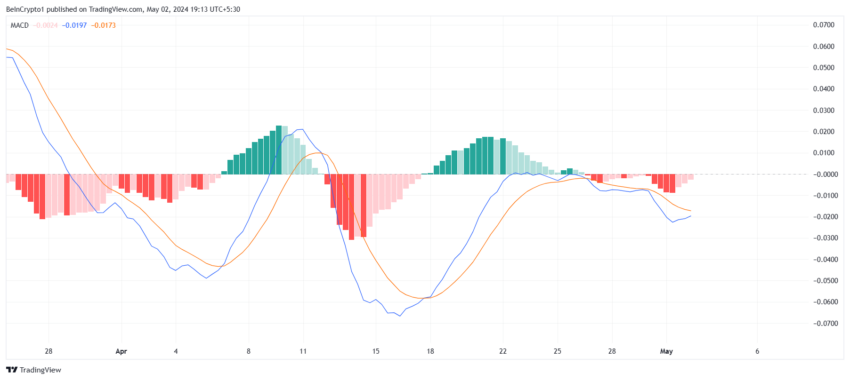
Fantom‘s price trading above $0.63 is a good sign that the altcoin is safe from diving further, as supported by the Moving Average Convergence Divergence (MACD). This technical analysis tool measures the relationship between two moving averages of an asset’s price. It provides insight into its momentum and potential buy or sell signals.
During recovery moments, the indicator line (blue) crosses over the signal line (red), confirming a bullish crossover. This is the expected outcome as these lines are inching closer. Once this happens, the Fantom’s price will be eligible for an increase.
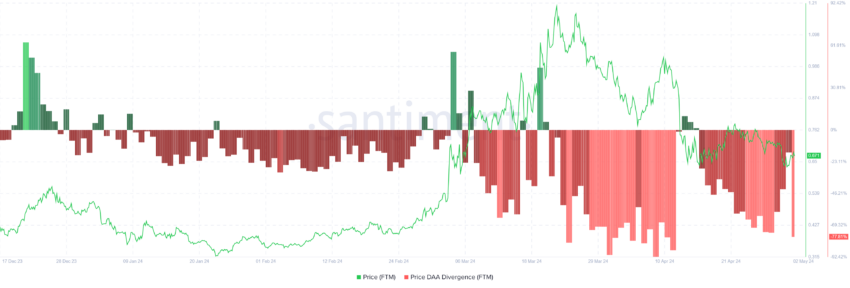
Fantom also shows a divergence in the price daily active addresses (DAA) indicator. This can be seen as a buy signal, suggesting an ideal accumulation zone.
This metric is used in cryptocurrency analysis to assess the relationship between an asset’s price and the number of active addresses transacting on its network. It indicates potential discrepancies between market valuation and network usage trends.
Whenever the price of an asset rises and participation decreases, a sell signal can be observed. Conversely, increasing participation and declining prices issue a buy signal, which is the case with FTM presently. If investors opt to make the most of this opportunity and stock up on FTM supply, it could see some recovery soon.
FTM Price Prediction: Rebound
At $0.67 at the time of writing, Fantom’s price maintains its presence above the key support of $0.63. This support line has been tested numerous times this year and remained unbroken since early March.
Such is the case with the resistance block of $0.79 and $0.88 as well. This block has been tested as support and resistance and is usually difficult to breach through or below.
Even if FTM does manage to post a rally in the next few trading sessions, it will halt the rise at $0.79, which is the lower limit of the resistance block. From there on, it is unclear whether to breach $0.80 or fail to do so.
Read More: Fantom (FTM) Price Prediction 2024/2025/2030
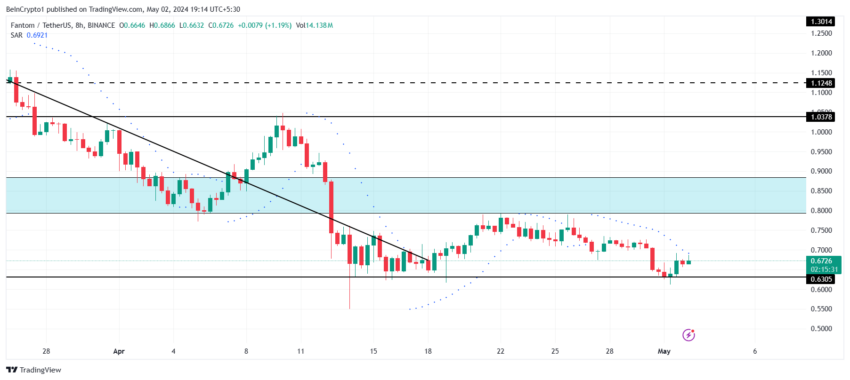
However, if the support of $0.63 is broken, Fantom’s price could note a considerable drawdown. Falling to $0.55 and below would invalidate the bullish thesis, enabling FTM to note further losses.


