Solana’s (SOL) price is close to witnessing a bearish phenomenon that threatens the altcoin for a potential correction.
Given the lack of support from the market and investors, it appears that a drawdown to $100 could be possible.
Solana Faces Bearish Cues
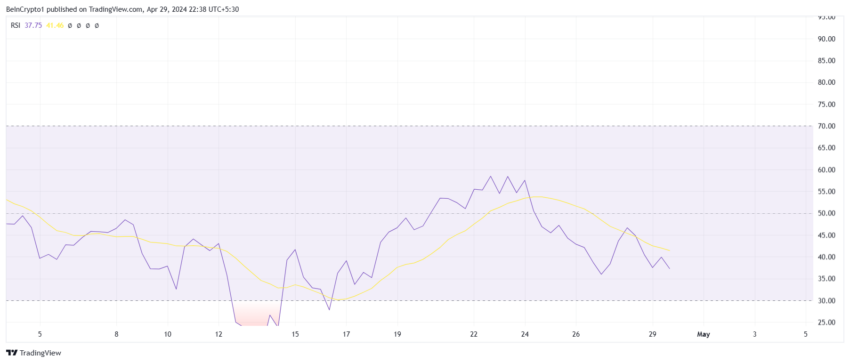
Solana’s price failed a bullish breakout last week and has been falling on the charts since then. The pessimism arising from the investors and the market has contributed to the declining value of the asset, as noted on the Relative Strength Index (RSI).
The RSI is a momentum oscillator that measures the speed and change of price movements, indicating overbought or oversold conditions. Currently, SOL is safe from being oversold, but the presence of the indicator below the neutral line in the bearish zone raises the possibility of correction.
This could also hint at a slowdown in SOL’s attempt at recovery.
Read More: How to Buy Solana (SOL) and Everything You Need To Know

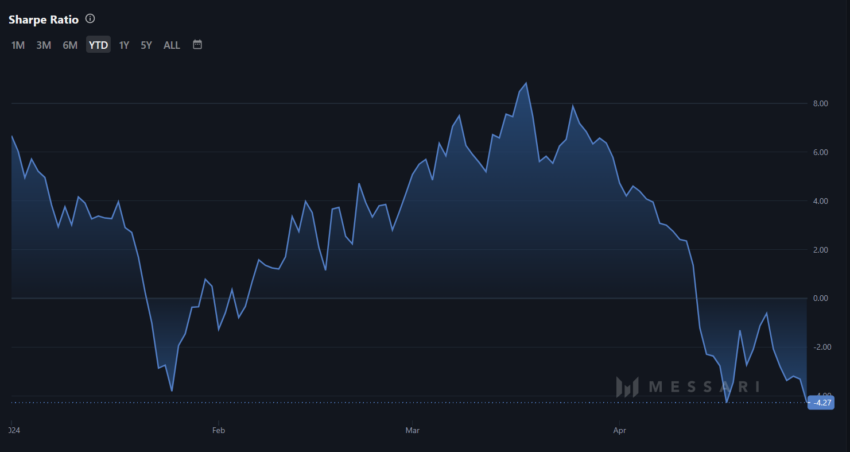
Secondly, any chance of recovery from Solana’s price from the investors will likely be washed away. The reason behind this is the lack of incentive at the moment, as noted on the Sharpe ratio.
The Sharpe ratio is a measure of risk-adjusted return calculated by dividing the excess return of an investment by its standard deviation. It helps investors evaluate the efficiency of an investment by comparing its return to its risk.
Low values often present the potential of investors backing away from investing in a project due to lower chances of profits. This is the likely outcome for Solana as well since the Sharpe Ratio is at -4.27%, the lowest in the last four months.

Thus, a lack of support on this front could further the declining value of Solana’s price.
SOL Price Prediction: A Fall Back to $100 Likely?
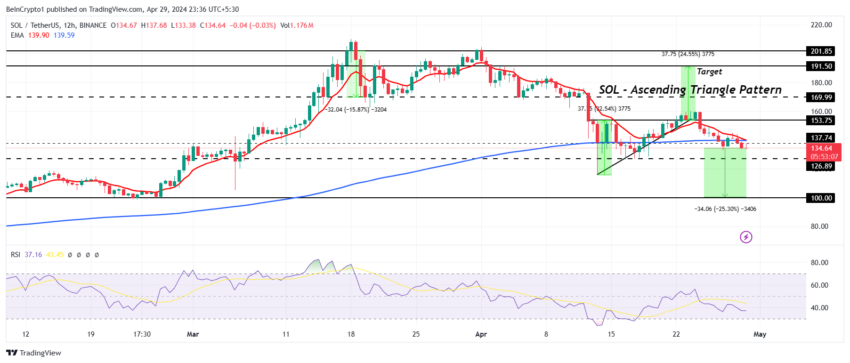
Solana’s price, at $134, failed to break out and rally as per the ascending triangle pattern SOL was moving in mid-April. Since then, the altcoin has been declining and now faces the threat of a death cross.
A death cross occurs in technical analysis when a short-term 50-day Exponential Moving Average (EMA) crosses below a long-term 200-day EMA, indicating a potential downtrend. It is often interpreted as a bearish signal for the market.
Read More: Solana (SOL) Price Prediction 2024/2025/2030

Should this cross occur, Solana’s price could fall to test the support at $126. Losing this support could drag SOL down to $100. This would mark a 25% correction and invalidate the bullish thesis as well.


