
In the past week, TRON (TRX) has drawn significant attention from traders, hinting at potential increased volatility in the near future. Despite a recent dip, the 7-Day Relative Strength Index (RSI) continues to hover in the overbought zone.
A noteworthy trend has emerged as the long-term Exponential Moving Average (EMA) line approaches the short-term EMA line. Read the full analysis for a more comprehensive insight.
TRON RSI Slips Below 70, but Still Shows Strength
In the final days of February, the 7-Day Relative Strength Index (RSI) for TRX peaked at 91. This indicated a highly overbought condition. Since that peak, the RSI has seen a substantial decrease, descending to 71. While this represents a significant drop of around 22%, an RSI value above 70 is still considered overbought.
Therefore, this suggests that TRX may be due for a price correction as traders who perceive the coin as overvalued at current levels could start selling off their holdings.
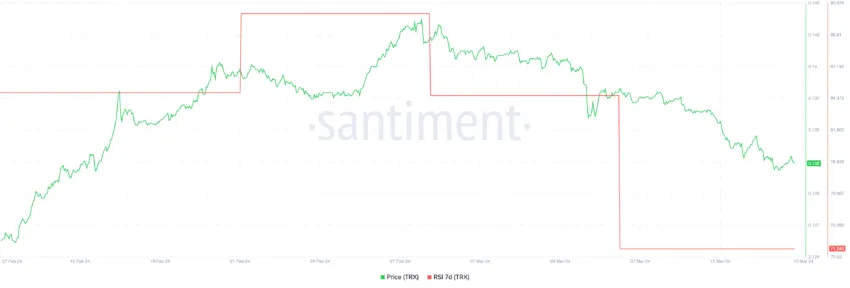
The RSI is a momentum oscillator that measures the speed and change of price movements. It oscillates between zero and 100 and is typically used to identify overbought or oversold conditions in a traded asset. An asset is generally considered overbought when the RSI is above 70, suggesting it might get overvalued. Conversely, an asset is often labeled as oversold when the RSI is below 30, indicating it might be undervalued.
Because of that, there’s a heightened possibility that we may witness a price retracement, particularly since the RSI has been consistently above 70. Investors and traders may interpret this as a sign to take profits. That would increase selling pressure and lead to a price decline.
TRX Traders Are on the Rise
The chart representing TRON (TRX) Balance by Time Held showcases the dynamics of TRX distribution among different holder categories:
- Hodlers, who have been holding their coins for over a year;
- Cruisers, with a holding period between one month and twelve months;
- Traders who hold their coins for less than a month.
Over the past week, there’s been a notable uptick in the TRX supply held by Traders. Their amount of TRX grew from 2.95 billion to 3.73 billion. This change represents an increase of approximately 26.44%, suggesting that short-term holders are gaining a larger stake in the circulating supply.
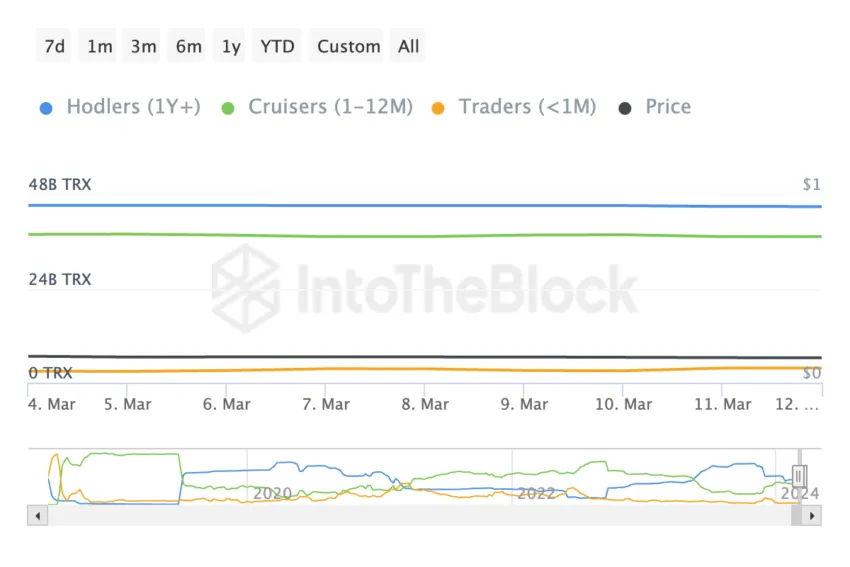
This kind of growth in a coin’s presence in the hands of short-term holders typically indicates an impending increase in price volatility. Short-term traders are more likely to react to market movements, buying and selling based on recent trends and events. This can lead to more pronounced swings in the coin’s price.
Consequently, such a significant growth in the balance of TRX held by Traders can have multiple impacts on the price. If these traders decide to sell their holdings, it can lead to an influx of supply in the market, driving the price down.
TRX Price Prediction: Strong Resistance Ahead
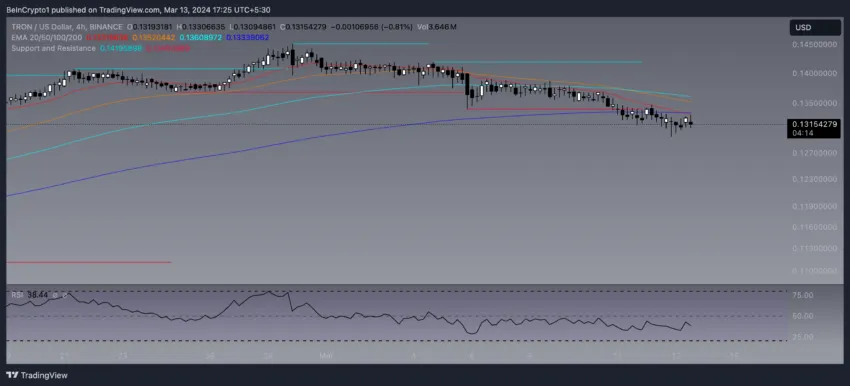
The chart below depicts TRX’s price action in relation to its Exponential Moving Average (EMA) lines. The 200-day EMA has crossed over the 20-day EMA and the price line. This is known as a ‘death cross’, interpreted as a bearish signal, suggesting that the long-term price momentum is declining. As a consequence, this may lead to further downward pressure on prices.
An EMA provides a weighted average of past price data, with more recent prices having a greater impact on the average. The EMA lines can act as dynamic support and resistance levels.
Analyzing the IOMAP chart, it’s possible to see that TRX has weak support at $0.127. If that support is not enough, its price could test new levels at $0.123 and $0.119. That would represent a 10% correction.
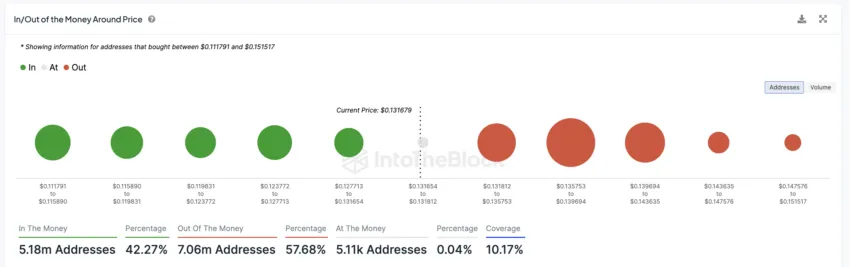
The IOMAP chart is a visualization tool that maps out the distribution of purchases across different price points, showing areas where investors might be:
- ‘In the Money’ (profiting from their purchase)
- ‘At the Money’ (breaking even)
- ‘Out of the Money’ (currently at a loss).
These clusters help predict future support or resistance levels, as investors could decide to buy more, hold, or sell their assets as the market price approaches their original purchase price.
In the case of TRX, IOMAP chart shows strong resistances ahead, the first one at $0.1318 and a bigger one at $0.135.


