What’s Next for TRON (TRX) Price Following a 20% Correction

Analysis1mos agoUpdate 6086cf...
44 0

In Brief

  • Tron (TRX) experienced fewer traders over the past 7 days, hinting at potential reduced volatility.
  • The RSI 7-Day dropped and is now positioned at 60, in the neutral zone, indicating consolidation.
  • EMA lines formed a death cross on April 2, indicating a possible downtrend despite strong support.

TRON’s (TRX) price dynamics indicate a move towards potentially lower volatility, highlighted by reduced trader activity in the past week.

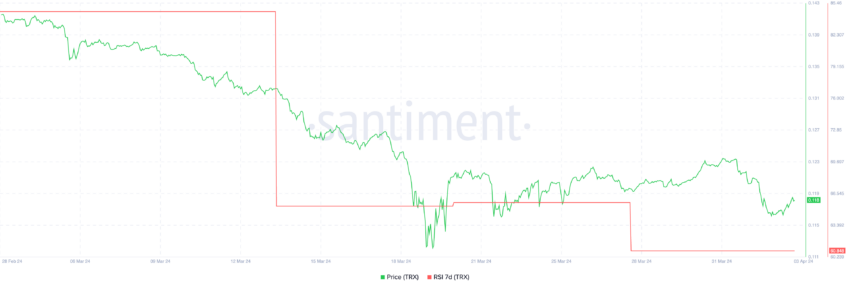
The Relative Strength Index (RSI) has adjusted to a neutral level at 60, suggesting that TRX is entering a phase of consolidation.

TRON Eyes a Consolidation Phase

The 7-day RSI for TRX has decreased from highs of 84.6 to 60.8. This is a pivotal metric for gauging whether TRON is overbought or oversold. It currently indicates a balanced market sentiment and equilibrium between buyers and sellers, pointing to potential consolidation ahead.

This period of consolidation, marked by stable prices within a narrow range, implies a balanced market sentiment that is likely to dominate in the upcoming days.

What’s Next for TRON (TRX) Price Following a 20% Correction
TRX Relative Strength Index. Source: Santiment.

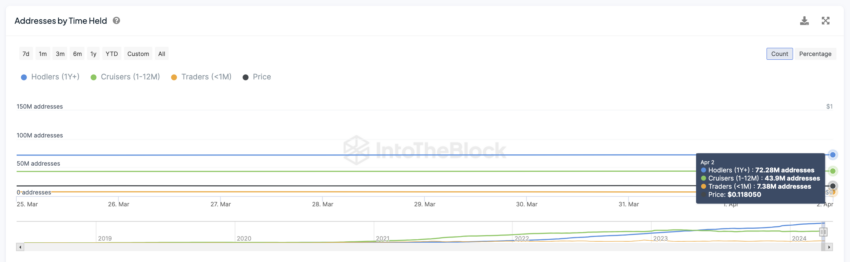
After months of increased activity, TRX has also seen a decrease in the number of traders holding the cryptocurrency, with a decline from 7.52 million addresses on March 25 to 7.38 million by April 2. This change suggests a move towards lesser price volatility, potentially leading to a more consolidated market phase.

What’s Next for TRON (TRX) Price Following a 20% Correction
TRX Addresses by Time Held. Source: Santiment.

TRX Price Prediction: Enough Support?

TRX recently experienced a technical pattern known as a death cross on April 2, where a short-term Exponential Moving Average (EMA) falls below a long-term EMA, often seen as a bearish signal. This event followed a 22.34% price correction after the previous death cross on March 5.

Given this scenario, TRX might enter a phase of consolidation, particularly with its RSI positioned at 60. Should the $0.1145 support level falter, TRX could decline towards $0.097, marking a low since December 2023.

Read More: TRON (TRX) Price Prediction 2024/2025/2030

What’s Next for TRON (TRX) Price Following a 20% Correction
TRX Price Chart. Source: TradingView.

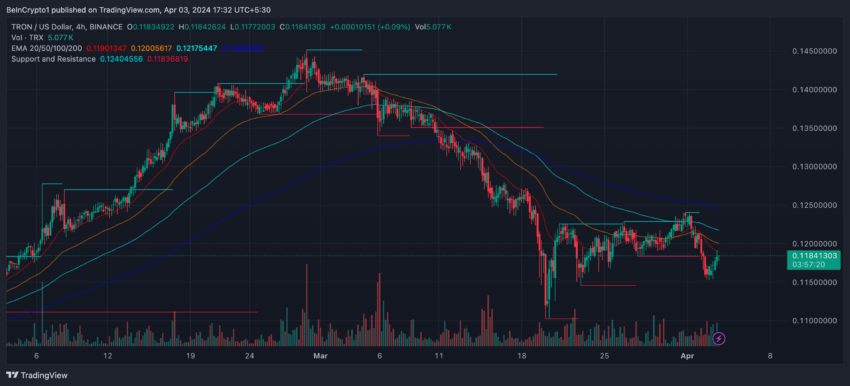
Conversely, bullish market sentiment could propel TRX towards testing the $0.14 resistance level, potentially initiating an uptrend.

This article is sourced from the internet: What’s Next for TRON (TRX) Price Following a 20% Correction

Related: Fetch.ai (FET) Analysis: What’s Next for Price After All-Time High?

In Brief Fetch.ai price marked a new all-time high over the weekend and is now likely looking to consolidate. The market top was validated with the recent correction. However, 93% of the supply in profit is still susceptible to selling. Declining network growth suggests waning investor interest, indicating bearish momentum ahead. Fetch.ai (FET) price is continuing its bullish streak even though the rest of the crypto market is cooling down from the February and March rallies. Will this lead to corrections for FET, or will the altcoin be able to note another all-time high? Fetch.ai Could Lose Support From Its Investors After a remarkable rise, Fetch.ai’s price is noting some drawdown until the market cools down. This was an expected decline since nearly 98% of the entire circulating supply was…


© Copyright Notice

Related articles

No comments

You must be logged in to leave a comment!
Login immediately
No comments...