
The PEPE price is poised for a notable decline, with whales halting their accumulation last week, reflecting a drop in investor interest. The shift of the SAR indicator from bullish to bearish, alongside a forecasted possible 40% correction, further shows the bearish outlook.
Additionally, the emergence of a death cross in the EMA lines suggests a strong downtrend could soon take hold. These technical indicators collectively signal a rough period ahead for PEPE, with a significant price drop likely, making it a critical moment for investors to watch closely.
Whales Are Not Accumulating PEPE
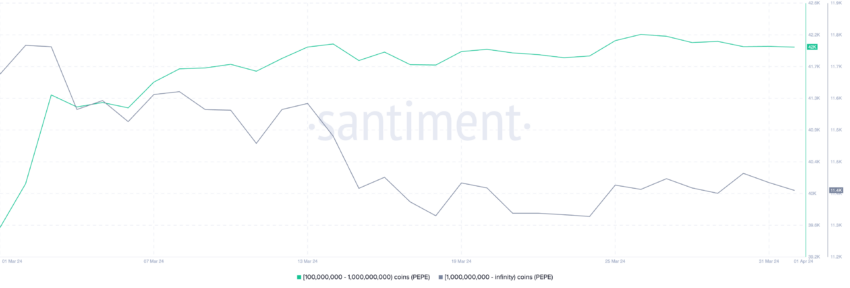
Analyzing the whale activity in the PEPE market reveals an intriguing scenario worth paying attention to. As of March 25, there has been a notable stabilization in the number of addresses holding at least 100M PEPE, suggesting a pause in the aggressive accumulation patterns previously observed.
Specifically, the cohort with holdings between 100 million and 1 billion PEPE has seen a slight decrease from 42,129 to 42,042 addresses. Similarly, the segment of investors with more than 1 billion PEPE has marginally diminished from 11,445 to 11,430 addresses.
This shift, though subtle, is significant when considering whale accumulation as a key metric for gauging market sentiment and potential price movements.
Whale activity is key for gauging a crypto market’s strengths or weaknesses. Their large-scale trades impact price directions, so their buying or selling trends are crucial for price predictions. The halt in PEPE whale buying since late March signals bearish trends.
This suggests big investors might lack confidence or are waiting for better conditions. After a period of active buying, this pause hints at fading momentum, likely pushing the PEPE price down.
Read More: Pepe (PEPE) Price Prediction 2024/2025/2030
PEPE SAR Just Changed Its Status
On April 1, the PEPE’s SAR indicator transitioned from bullish to bearish, a shift that has already led to a decline in its price from $0.0000091 to $0.0000070, marking a decrease of approximately 23.08%. The SAR (Stop and Reverse) metric is a pivotal tool for identifying potential market reversals by placing dots either above or below the price line.
When the dots are positioned above the price, it suggests a bearish outlook, and conversely, the dots below indicate bullish momentum. Currently, the SAR metric for PEPE is decidedly bearish. Its dots are above the price line and demonstrate a pronounced downward curve, signaling strong bearish momentum.
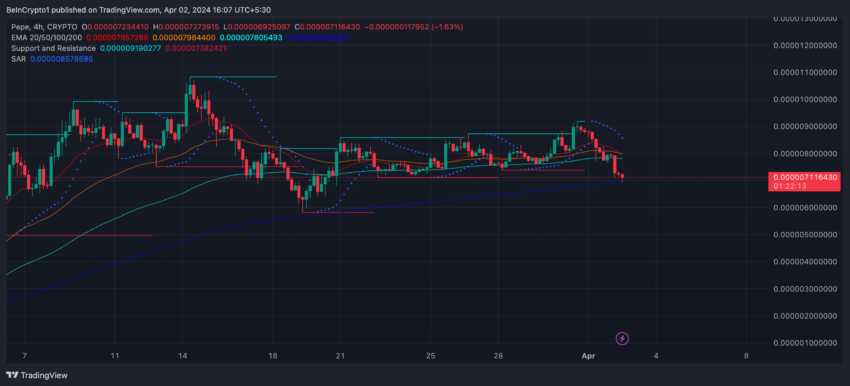
This bearish posture is particularly concerning given the last occasion when the SAR dots curved downwards sharply and rapidly, the PEPE price experienced a significant correction, plummeting from $0.0000093 to $0.0000058. This represented a staggering correction of approximately 37.63% in just four days.
The current SAR configuration, mirroring this previous pattern, strongly suggests that PEPE could be on the verge of another sharp decline. Investors and traders alike should heed this bearish signal, as the SAR metric’s predictive accuracy in indicating swift market downturns has been demonstrated with PEPE’s historical price movements.
PEPE Price Prediction: Is A 29% Correction Imminent?
PEPE’s EMA (Exponential Moving Averages) Lines are nearing a death cross, signaling a bearish outlook. This occurs when the 50-day EMA falls below the 200-day EMA, for example. Such a move suggests short-term prices are dropping below long-term averages, hinting at a downward trend.
The death cross flags a potential major drop, as it shows declining momentum. EMA Lines, which emphasize recent prices more, help spot trends and their possible shifts. This feature of EMA Lines is crucial for predicting market movements.
Given the imminent formation of a death cross in PEPE’s EMA Lines, alongside the stagnation in whale accumulation and a bearish SAR metric, there is a compelling case for a strong correction in PEPE’s price in the near future.
Read More: 5 Best Pepe (PEPE) Wallets for Beginners and Experienced Users
If the anticipated downtrend materializes, PEPE’s price could plummet from $0.0000070 to $0.00000495, equating to a correction of approximately 29.29%. The price may descend to test the $0.0000010 support zone if this support level fails to hold.
However, should an uptrend unexpectedly emerge, PEPE might attempt to breach resistance levels at $0.0000087 and $0.0000095, offering a glimmer of hope for a reversal from the current bearish sentiment.


