
The Cardano (ADA) price is noting the formation of a bearish reversal pattern, according to which a larger-than-expected correction is due for the altcoin.
At the same time, ADA is ripe for the picking, and this sentiment alone could buffer the potential decline.
Whales Are Pulling Back
Whales are one of the most important and influential cohorts for any cryptocurrency since their movements impact price action the most. Such is the case with Cardano, too.
Despite whales holding less than 20% of the circulating supply, their dominance over the daily transaction volume makes them a crucial cohort. Out of the $17.7 billion traded throughout the last 24 hours, these whales conducted about $17.4 billion worth of transactions.
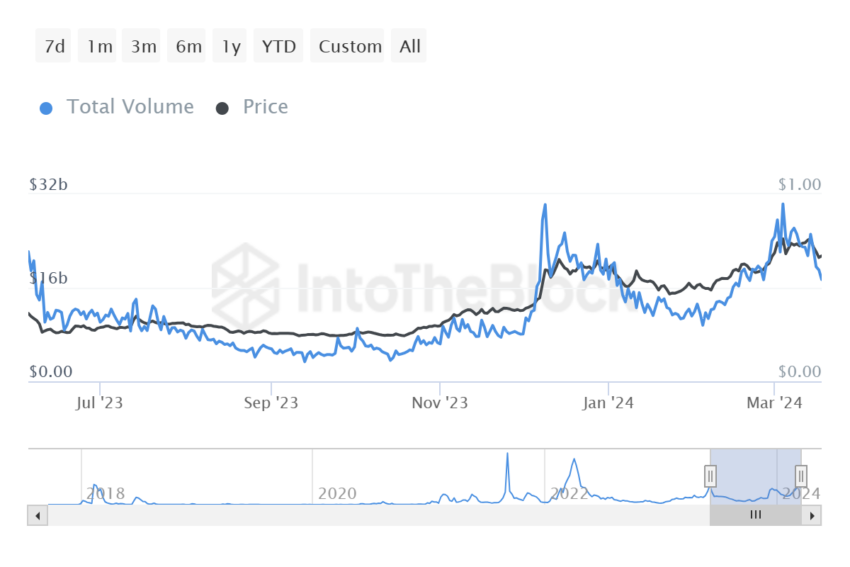
However, this is much lower than their transactions five days ago when they moved about $23 billion worth of ADA across addresses. This decline exhibits the waning bullishness among whales, which in turn will negatively impact the price action.
ADA Price Prediction: Major Corrections Are on the Way
Cardano’s price can be seen trading at $0.618 at the time of writing, losing the support of $0.619 following a 6% correction today. The third-generation cryptocurrency is witnessing a double-top pattern forming on the daily chart. At the moment, $0.619 forms the breakout point of the pattern.
The double top pattern is a bearish reversal pattern in technical analysis. It is characterized by two consecutive peaks at similar price levels, indicating a potential trend reversal from bullish to bearish. It suggests that buyers are losing momentum, often followed by a downward price movement.
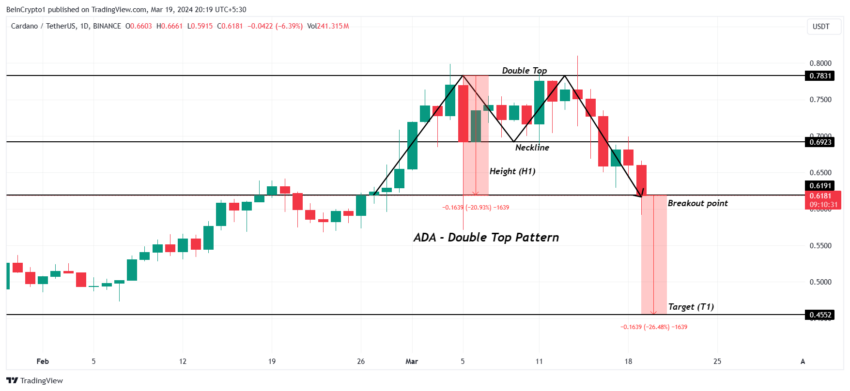
Per this pattern, the target price of the bearish reversal is established at $0.455, nearly 26% below the breakout point.
Good Opportunity for Investors
While the forecast is bearish, Cardano’s price drawdown has created a rather optimal environment for accumulation. According to the Market Value to Realized Value (MVRV) ratio, ADA is in the opportunity zone.
MVRV is a metric used to compare the current market capitalization to the realized cap. This indicates whether a cryptocurrency is overvalued or undervalued relative to its historical price. The 30-day MVRV at -13.45% means that investors who bought their ADA in the past month are witnessing 13.45% losses at the moment.
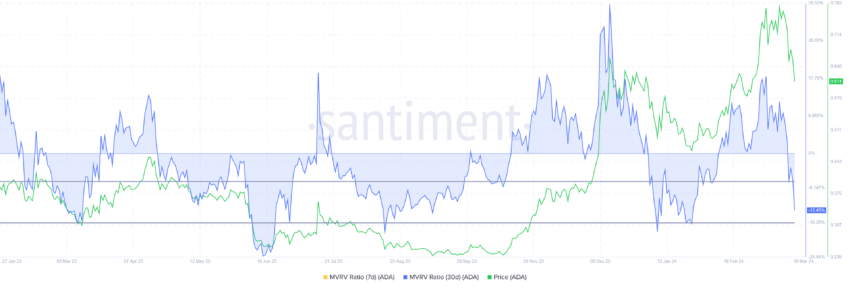
This also means that the indicator is in the opportunity zone, ranging between -8% and -18%. Historically, this zone has seen price reversals, making it optimum for ADA accumulation.
The accumulation could, consequently, trigger a bullish reversal, which could, in return, invalidate the bearish thesis by preventing a decline below $0.580.


