
Bitcoin Cash (BCH) price skyrocketed by 58% in a single day, leaving many investors wondering if this is the start of a sustained rally or a fleeting pump. While the surge is undeniably impressive, market signals are flashing caution, suggesting a strong correction might be on the horizon.
The balance of Bitcoin Cash holdings has shifted, with traders now holding more than mid-term holders. This could indicate increased volatility in the near future, as traders are more likely to buy and sell quickly based on short-term price movements.
BCH RSI Value is Rising Fast
Bitcoin Cash (BCH) has experienced a significant increase in its Relative Strength Index (RSI) over the past seven days. The RSI, a technical analysis indicator used to measure momentum in price movements, has risen from 60 to 78.28. This now places BCH in the overbought territory, which could signal potential selling pressure in the near future.
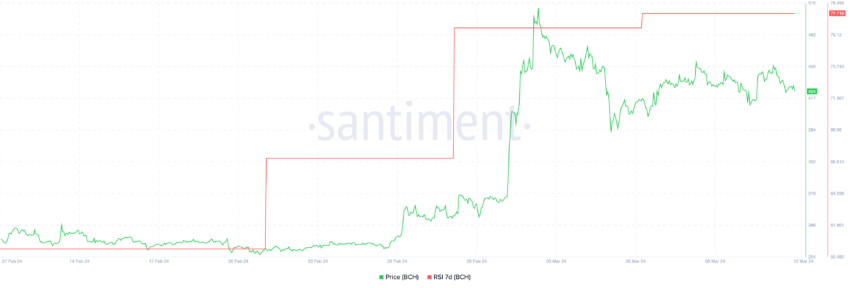
For clarification, the RSI oscillates between 0 and 100. Readings above 70 generally indicate overbought conditions, suggesting the price may have risen too quickly and could be due for a correction. Conversely, readings below 30 suggest oversold conditions and potential for price rebounds.
Interestingly, the last time BCH 7-day RSI surpassed 78, in June 2023, was followed by a substantial price correction of approximately 26% within the subsequent 15 days. This historical precedent suggests that BCH’s current RSI reading warrants close observation by market participants.
BCH Traders Flipped Mid-Term Holders
A recent development within the BCH market warrants close attention from investors and analysts. A demonstrably significant shift in ownership structure has emerged, with traders assuming a dominant role.
Traders, in this context, are defined as those holding BCH for a period of less than one month. This specific group has recently surpassed cruisers, who hold BCH between 1 and 12 months in terms of the total amount of BCH they control.
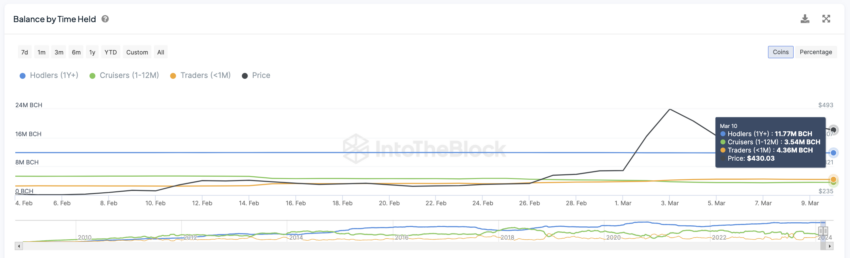
The magnitude of this shift cannot be understated. Data obtained on February 4 indicates that traders held 2.53 million BCH. However, this number substantially surged by March 10, reaching 4.36 million BCH. This rapid increase in holdings by short-term traders necessitates a review of historical precedents.
Traditionally, a larger supply of BCH controlled by short-term holders has correlated with increased market price volatility. Therefore, this recent trend suggests a potential for heightened price fluctuations for BCH in the foreseeable future.
BCH Price Prediction: Weak Support and Strong Resistance
An analysis of the In/Out of the Money Around Price (IOMAP) metric for BCH reveals critical support and resistance zones that could influence its near-term price trajectory.
The IOMAP analysis highlights potential weaknesses in support around $415 and $402 in the current BCH market. If the price of BCH fails to hold at these support levels, it could experience a downward correction as low as $388 or even $375. This scenario translates to a potential price decline of approximately 13.60% for BCH.
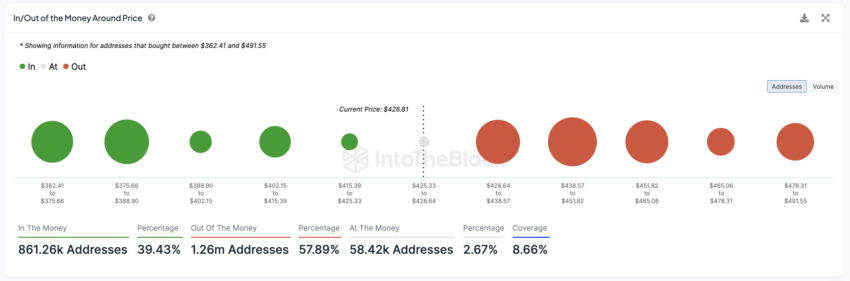
The IOMAP metric visually identifies areas on a price chart where many addresses previously bought BCH. Depending on the current price action, these areas can represent potential support or resistance levels.
A bullish breakout for BCH could occur if the price surpasses the identified resistance levels of $428 and $438. Such a breakout could propel BCH towards a price of $465, representing a potential growth of 9.18%.
Therefore, close monitoring of these IOMAP-derived support and resistance zones is crucial for understanding potential price movements for BCH in the coming period.


