
The Shiba Inu (SHIB) price finally broke out from a 560-day descending resistance trend line and is attempting to close above it.
Despite the long-term breakout, SHIB faces resistance on the lower timeframes.
SHIB Finally Breaks Out From Long-Term Resistance
The weekly time frame technical analysis shows that the SHIB price broke out from a descending resistance trend line. This trend line had existed for 560 days, successfully rejecting Shiba Inu’s price thrice.
On February 20, SHIB was able to breach such a massive resistance zone and reach a high of $0.00000147 before falling slightly. This was the highest price since February 2023, and SHIB has yet to reach a weekly close above it.
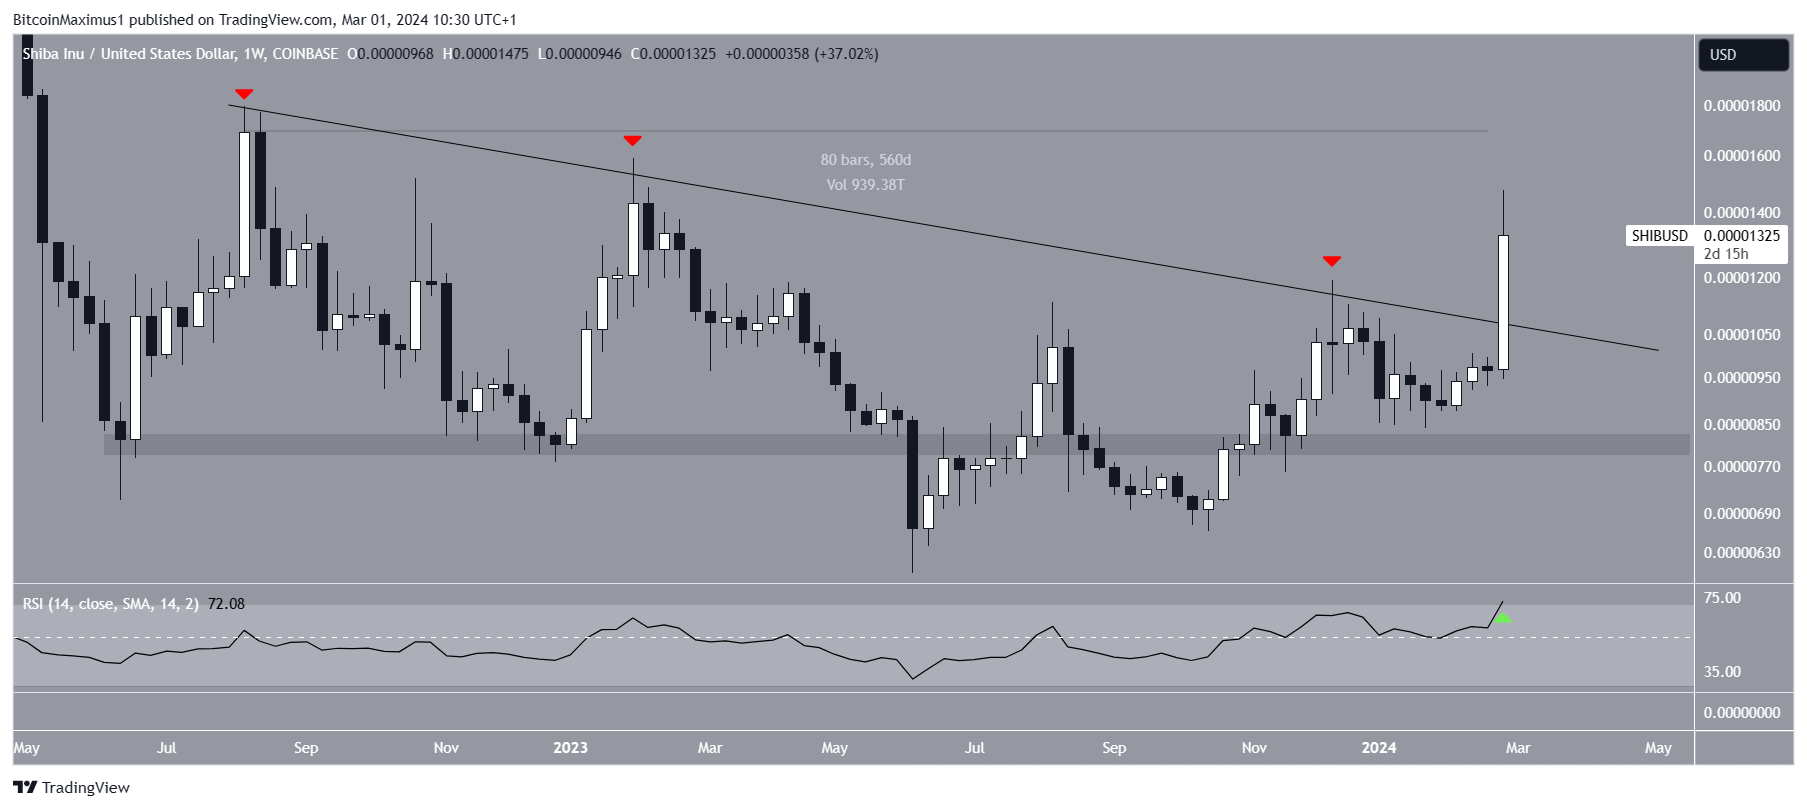
The weekly Relative Strength Index (RSI) supports the breakout. When evaluating market conditions, traders use the RSI as a momentum indicator to determine whether a market is overbought or oversold and whether to accumulate or sell an asset.
Read more: 6 Best Platforms To Buy Shiba Inu (SHIB) in 2024
If the RSI reading is above 50 and the trend is upward, bulls still have an advantage, but if the reading is below 50, the opposite is true. The indicator moved above 70 (green icon) during the breakout, indicating a bullish trend.
SHIB Price Prediction: Is the Breakout Confirmed?
The technical analysis from the daily time frame shows that despite the long-term Shiba Inu breakout, the price has yet to move outside its long-term ascending parallel channel.
Rather, it reached it yesterday and was rejected, creating a long upper wick. The channel has existed since June 2023, and this was the second touch of the resistance trend line. Even though the price has not broken out, the daily RSI has turned bullish since the indicator moved above 70.
If SHIB breaks out, it can increase by 35% to the next resistance at $0.0000180.
Read more: How To Buy Shiba Inu (SHIB) and Everything You Need To Know
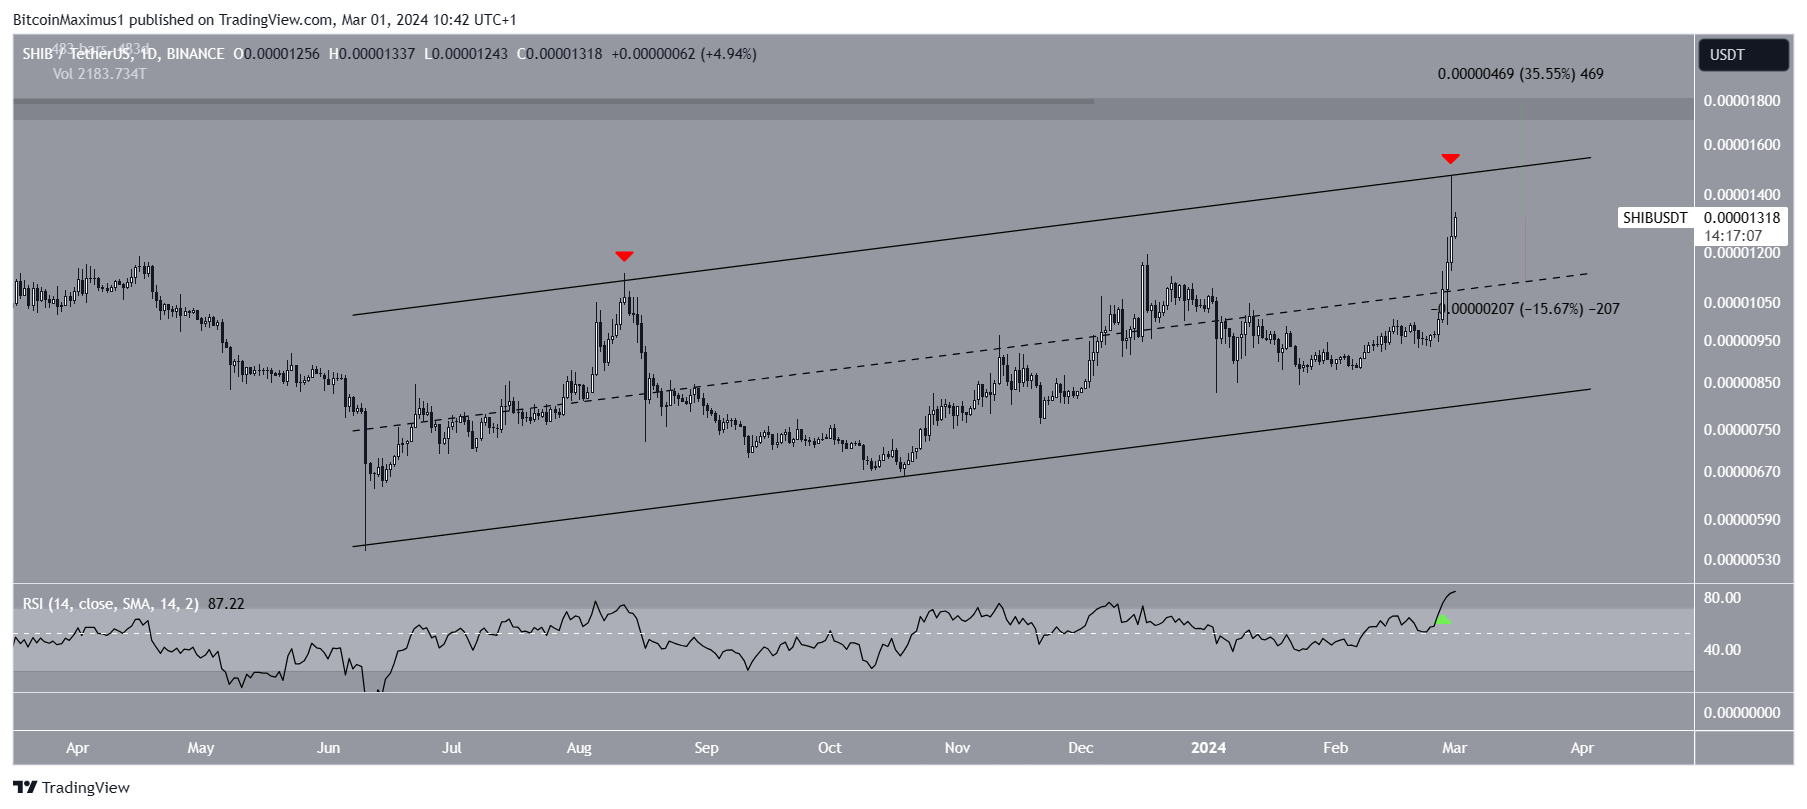
Despite the bullish SHIB price prediction, a rejection from the trend line can trigger a 15% drop to the middle of the channel at $0.0000110.


