
The Bitcoin price surged 155% in 2023 after a long-term bear market ended in late 2022. After reaching a macro bottom in the $15,500 area, the largest cryptocurrency began a period of accumulation and slow increase typical of an early bull market.
However, by the beginning of 2024, Bitcoin will have reached around $57,000. Therefore, the first on-chain indicators that suggest the start of a mature bull market in the cryptocurrency sector are emerging. This period, in which the price of BTC increases most rapidly, historically began only about 6 months after the halving.
In this cycle, will Bitcoin’s parabolic rises and new all-time high (ATH) occur around halving already? Or should a deeper correction be expected soon? Let’s find out!
2 On-Chain Indicators: Short-Term Holders Buy BTC
The first on-chain indicator that suggests the start of a mature bull market is Realized Cap HODL Waves. This indicator weighs the basic HODL Waves indicator by realized price. HODL Waves, on the other hand, is the set of all active supply age bands, or HODL waves. Each colored bar shows the percentage of existing Bitcoins that were recently moved during the selected period.
In other words, the Realized Cap HODL Waves indicate the change in Bitcoin distribution according to the holding period and the behavior of its owners. Generally, short-term HODL waves (red and orange, less than 6 months) contract during a bear market. In contrast, during a bull market, the proportion of long-term waves (green and blue, over 6 months) shrinks as holders sell their long-held coins.
At the top of the cycle, this leads to a situation in which most coins are held for short periods in short-term HODL waves (red areas). Such a condition quickly leads to a blow-off top and precedes a long-term bear market.
On the other hand, once the declines are over, the red and orange HODL waves remain flat for a long time and have little market share. It is only at the beginning of the mature phase of subsequent bull markets. This is where the chart shows a sharp increase in their size (green areas).
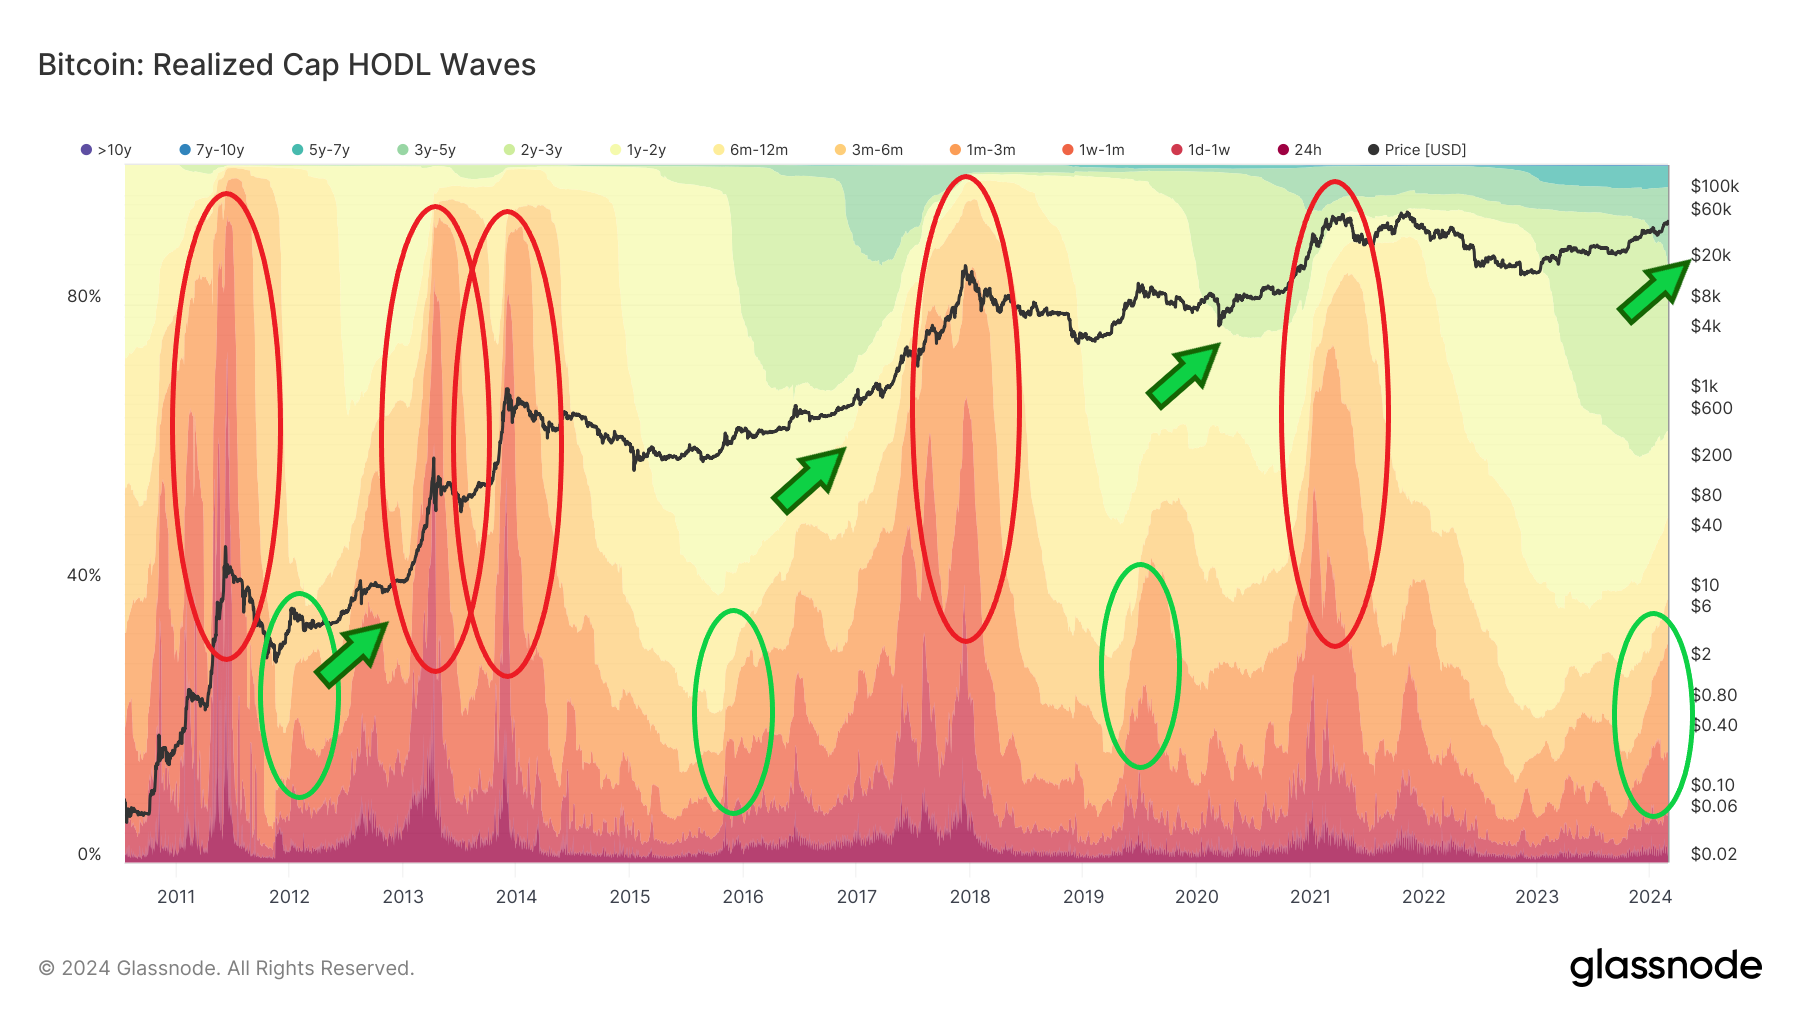
If this interpretation is correct, the Bitcoin market has just entered a mature bull market phase. This one has historically led to a new all-time high (ATH). But also to prices many times above previous peaks.
Long-Term Holders (LTH) Begin to Sell
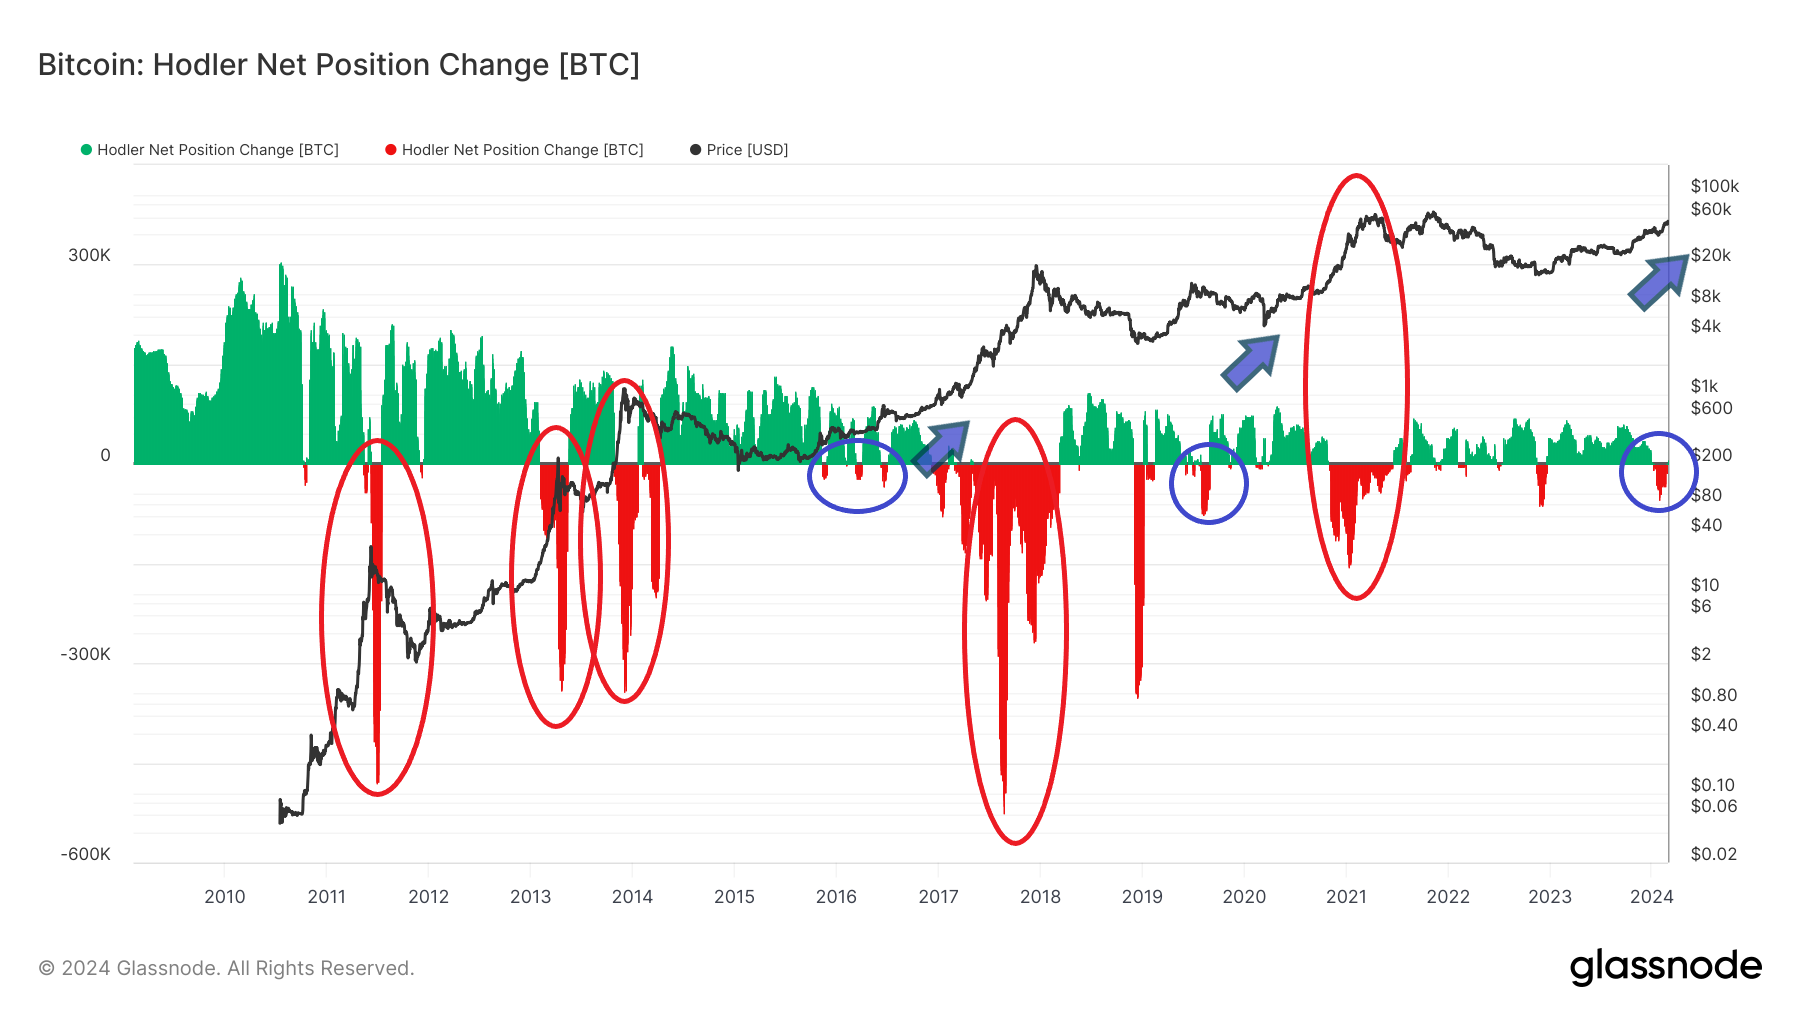
Another indicator whose interpretation points to the same key moment in the BTC market is the Hodler Net Position Change. The indicator shows the monthly position change of long-term investors (HODlers, LTHs). So it indicates when LTHs reduce their positions (red) and when they accumulate new net positions (green).
Historically, the largest periods of position reduction are associated with market peaks (red areas). However, the decline in BTC reserves can also be seen at the bottom of a bear market. This is associated with the capitulation of long-term hodlers at the end of the cycle.
However, the onset of increased LTH selling activity most often suggests the beginning of the mature phase of the bull market (blue areas). After these initial signals of BTC transfer toward short-term holders, historically, the main phase of the bull market (blue arrow) began.
If the situation also repeats itself this time, these 2 on-chain indicators clearly indicate the phase of the Bitcoin cycle. However, despite the similarities, each cryptocurrency market cycle has its own unique characteristics that escape historical patterns.
Besides, the cryptocurrency market is still characterized by high volatility, which allows regular corrections of 20-30%. However, in a mature bull market, such dips turn out to be excellent buying opportunities and the application of “buy the dip” strategies.
For BeInCrypto’s latest crypto market analysis, click here.