 .60 on the Horizon?" alt="Ripple (XRP) Price Correction: Is a Drop to $0.60 on the Horizon?" width="850" height="478" />
The recent upswing in XRP price has garnered significant investor interest. Nevertheless, current technical indicators indicate an unsustainable increase, prompting market analysts to anticipate a potential reversal.
A closer examination of the numbers reveals a possible impending price decline, threatening to disrupt the recent phase of price equilibrium.
Ripple Trading Volume Is Declining
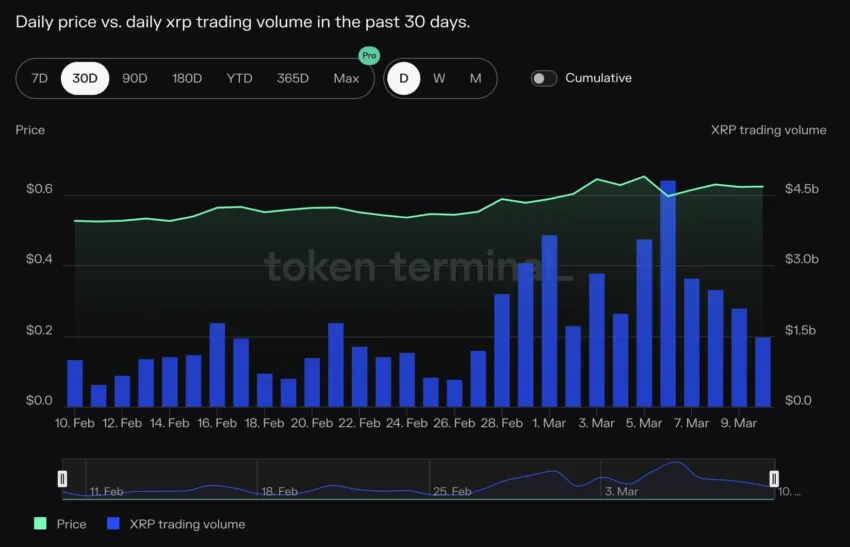
Over the span from February 10 to March 6, Ripple’s (XRP) daily trading volume expanded by over four times. Despite this impressive growth in trading activity, there has been a noticeable downward trend recently. The trading volume has diminished for four successive days, culminating in a notable dip to $1.5 billion on March 10, the lowest volume Ripple has seen since February 27.
 .60 on the Horizon?" />
This pattern of trading volume presents a picture of market behavior, especially when considering the relationship between the volume and XRP price movements over the last month. During this period, as the trading volume surged, the price of XRP correspondingly rose from $0.52 to $0.59.
XRP MVRV Increases
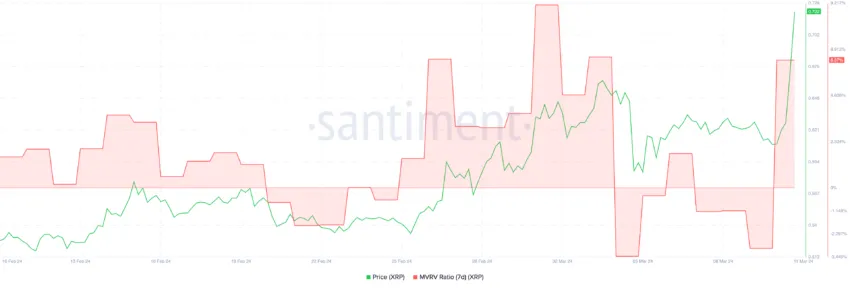
The MVRV 7D metric for XRP has been volatile, starting over 9% on March 3. It dropped to just 1% by March 8, then rose above 6% on March 11. Initially, high MVRV meant traders saw notable profits, potentially leading to sales for gains. A fall to 1% suggests a drop in XRP market value or low-price transactions.
The MVRV (Market Value to Realized Value) 7D ratio is a metric used to gauge the average profit or loss of assets transacted over a seven-day period. An MVRV above 0% suggests that, on average, the holders who transacted in the last week are profitable; below 0% would indicate they are at a loss.
 .60 on the Horizon?" />
The recent recovery to above 6% resulted from a strong rebound in price. A sudden increase in MVRV in such a slow amount of time could raise a red flag, as investors can start liquidating their profits, which could trigger selling pressure.
RSI Pumped Recently
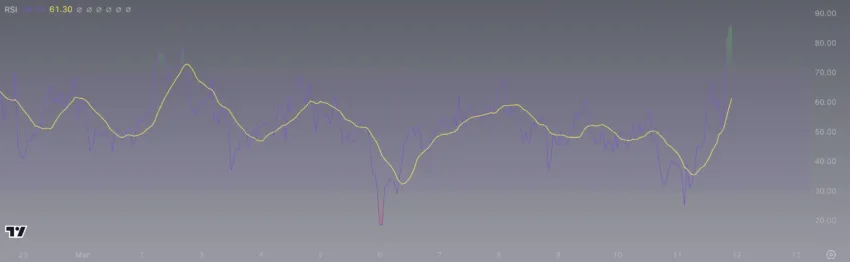
The RSI has moved significantly from 35 to 61 in just a few hours. An RSI of 35 is closer to the oversold territory, indicating that the price might have been undervalued or that selling pressure was nearing exhaustion. This could lead traders to anticipate a potential reversal or bounce back in price, as traders might see this as an opportunity to buy at a lower price.
 .60 on the Horizon?" />
The Relative Strength Index (RSI) is a momentum indicator used in technical analysis that measures the magnitude of recent price changes to evaluate overbought or oversold conditions in the price of an asset. Typically, an RSI reading above 70 indicates that an asset may be overbought, while a reading below 30 suggests it may be oversold. The RSI moves between 0 and 100, providing a signal of the asset’s internal strength.
The rapid increase to 61 signals a strong buying momentum and a shift away from oversold conditions. This sharp rise can often be bullish, potentially leading to further price increases if the trend continues. However, if the RSI continues to climb rapidly and crosses the 70 threshold, it could also suggest that the asset is becoming overbought. This may lead to a subsequent pullback if traders start to sell off their positions to realize profits.
XRP Price Prediction: Trend May Not Be Enough
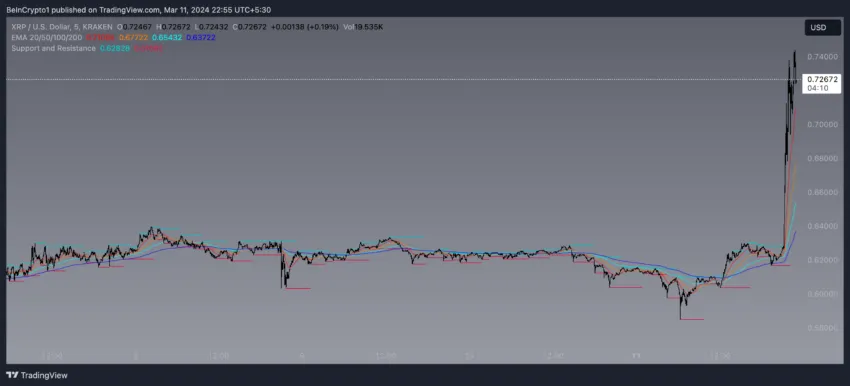
The chart shows that the EMAs (Exponential Moving Averages) are in a bullish alignment, with the short-term EMAs above the longer-term EMAs. This configuration often indicates an upward trend, with the price above the EMAs reinforcing this bullish signal. The steeper the slope of the EMA lines, the stronger the trend.
However, metrics such as MVRV and RSI could prevent the uptrend from continuing.
 .60 on the Horizon?" />
Support and resistance levels are also highlighted. The support level at $0.62 represents a price level where the asset has found significant buying interest in the past. The resistance level at $0.72 represents a price point where selling pressure has previously been strong enough to prevent the price from rising.
If the XRP price stays above the resistance-turned-support level, it could suggest a continuation of the upward trend. However, if the price falls below this level, it might indicate that the breakout was not sustained, and the price could fall back to test lower support levels at $0.62, $0.60, or even $0.58.


