
Chainlink (LINK) price exhibits signs of a bullish uptrend shaped by compelling market data. The convergence of key indicators suggests a climb that seasoned and novice investors watch with keen interest.
Dive into the analysis of LINK’s recent exchange data, holder profitability, and community sentiment to understand why a price target of $24 could happen soon.
Holders Are Accumulating LINK
Recent observations on LINK exchange net position change reveal a compelling narrative of accumulation. A notable surge in LINK tokens on exchanges between February and March indicates investors’ inclination to sell. This trend typically signifies their readiness to liquidate holdings.
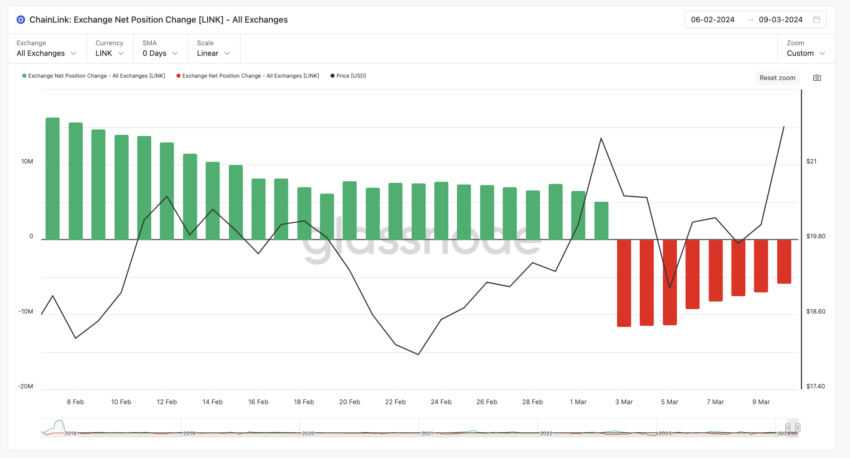
This particular trend underwent a notable transformation on March 3, marking a significant shift in the trajectory of the LINK Net Position Change on Exchanges. For a span of eight consecutive days following this pivotal date, the metric exhibited a consistent movement toward negative values.
A negative indication within this parameter typically implies a pattern of investors actively removing their LINK holdings from exchange platforms. This behavioral pattern serves as a notable indicator of the prevailing sentiment among holders, suggesting a deliberate reluctance to divest their tokens in the immediate future hastily.
Instead, it implies a more optimistic outlook or a calculated decision to retain their investments with the anticipation of reaping potential long-term benefits.
Chainlink Negative Sentiment Is Decreasing
On March 9, the LINK Weighted Sentiment indicator plummeted to -1.46, marking its most significantly negative position since August 2023. This metric experienced a noteworthy adjustment between March 9 and March 11, shifting to -0.88 from its previously more negative value.
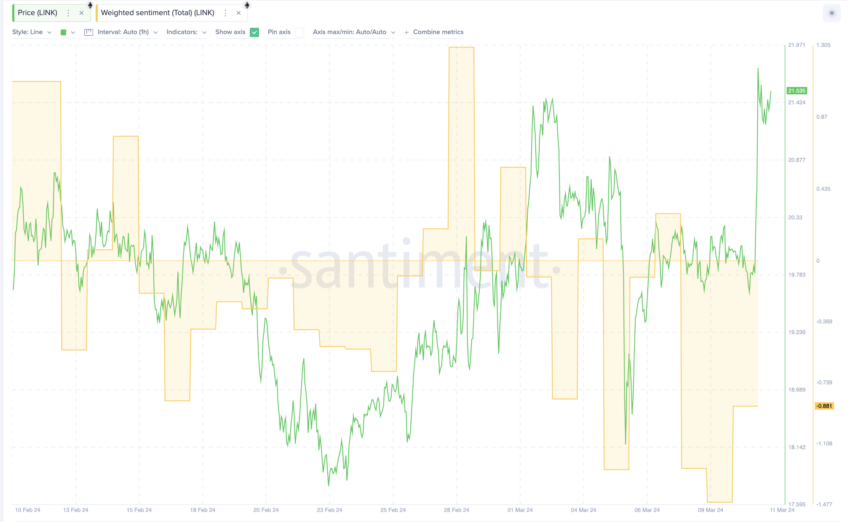
The Weighted Sentiment metric serves as a strategic tool crafted to delve into the overarching atmosphere permeating the Chainlink ecosystem.
Although initially characterized by a negative LINK Weighted Sentiment, the notable ascent from -1.46 to -0.88 over a two-day period subtly implies an evolution in market perceptions. This gradual shift alludes to the possibility of a forthcoming transition towards a more optimistic sentiment.
LINK Price Prediction: Poised to Reach $24 Soon?
The ‘In/Out of the Money Around Price’ chart for LINK shows that many buyers are currently making a profit, with the strongest support between $18.27 and $20.87. This means if the price starts to drop, it could likely stop and bounce back.
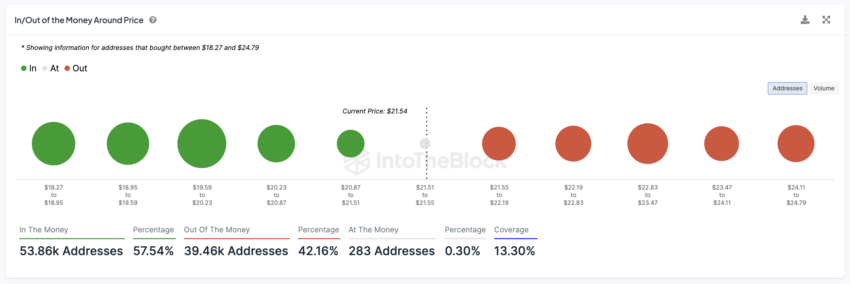
Just above the current price of $21.54, we hit areas where more investors might be waiting to sell, marked by red bubbles from $21.55 to $24.79, a 15% price growth. These areas could make it harder for the price to climb, as investors might sell to take small profits.
With continued buyer interest outpacing sales, LINK can surpass obstacles towards $24, its highest price since December 2021.
The bullish outlook will be invalidated if the LINK price falls below the strong support level at $20.70. If it breaks this support level, we could set a bearish target around $20 or even $19.45.


