
The Ethereum (ETH) price has recently found support at the 0.382 Fibonacci level, around $2,867, prompting a bullish rebound. This development raises the question: Could this mark the conclusion of the correction?
ETH has undergone a pronounced corrective phase over the past few weeks. However, the recent bounce from significant support levels suggests a potential reversal in this trend.
Ethereum’s Quick Recovery from 0.382 Fib Support at $2,867
The Ethereum price recently rebounded from the 0.382 Fibonacci support level around $2,867. After an initial bounce, it retraced back to this support level. However, Ethereum experienced a sustained upward trajectory during the subsequent rebound over several days.
Ethereum is encountering significant resistance at the 50-day Exponential Moving Average (EMA), around $3,277. Furthermore, notable Fibonacci resistance levels lie at approximately $3,320 and $3,650. It’s important to note that the corrective phase will likely conclude upon surpassing the golden ratio resistance at around $3,650.
Breaking out of the parallel descending channel would signal a bullish trend reversal for Ethereum. In such a scenario, Ethereum could potentially target or surpass its previous high of around $4,095.
Read More: Ethereum Restaking: What Is It And How Does It Work?
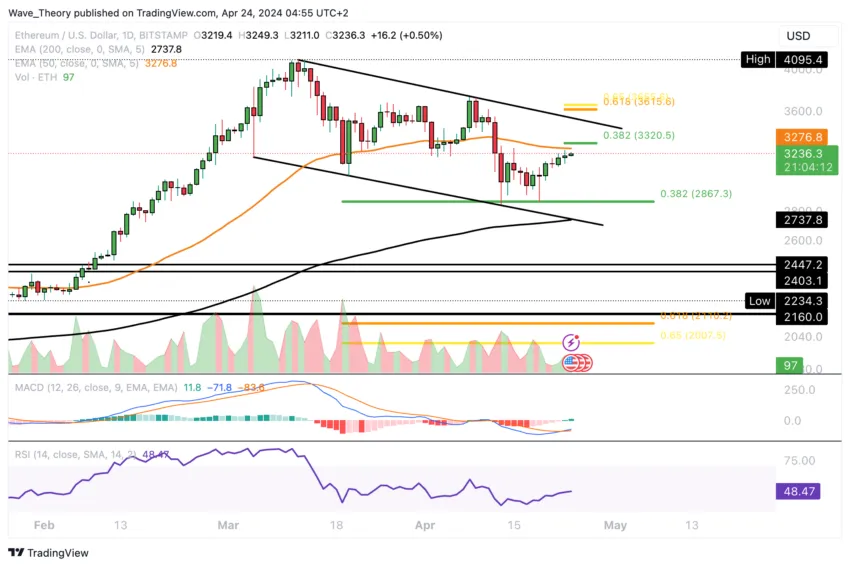
Moreover, the daily chart’s EMAs continue to exhibit a golden crossover, indicative of a bullish trend in the short to medium term. Additionally, the bullish crossover of the Moving Average Convergence/Divergence indicator (MACD) lines and the upward movement of the MACD histogram in recent days further support the bullish outlook.
However, the Relative Strength Index (RSI) remains neutral, providing no indication of bullish or bearish momentum.
Ethereum Faces Death Cross on 4-Hour Chart
In Ethereum’s 4-hour chart, a death cross materialized recently, solidifying the short-term bearish sentiment. However, if Ethereum sustains its upward momentum and surpasses the 0.382 Fibonacci resistance level around $3,320, it could prompt the EMAs to undergo a golden crossover.
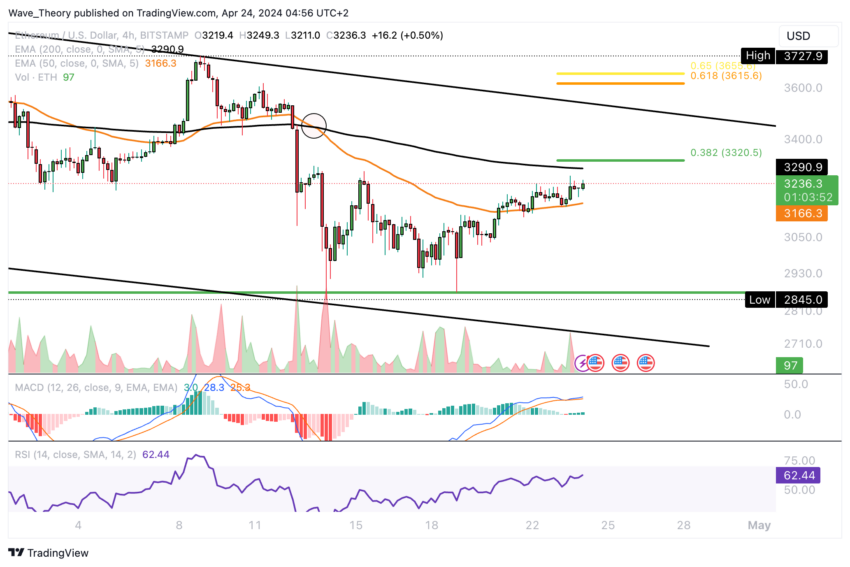
Such a development would signal a return to a bullish trend in the short term. Additionally, current indicators lean towards a bullish outlook.
The MACD histogram is on an upward trajectory, accompanied by the bullish crossover of the MACD lines, while the RSI remains in neutral territory.
MACD Lines Cross Bearishly on Weekly Chart
In Ethereum’s weekly chart, the recent bearish crossover of the MACD lines and the downward trend of the MACD histogram over the past few weeks suggest a prevailing bearish sentiment.
Despite Ethereum’s decline of approximately 30.5% from its peak seven weeks ago, the recent bounce from the 0.382 Fibonacci support level around $2,867 has led to a recovery of approximately 15%.
The ongoing presence of bullish confirmation from the EMAs and the neutral stance of the RSI indicates a somewhat optimistic outlook for Ethereum at present.
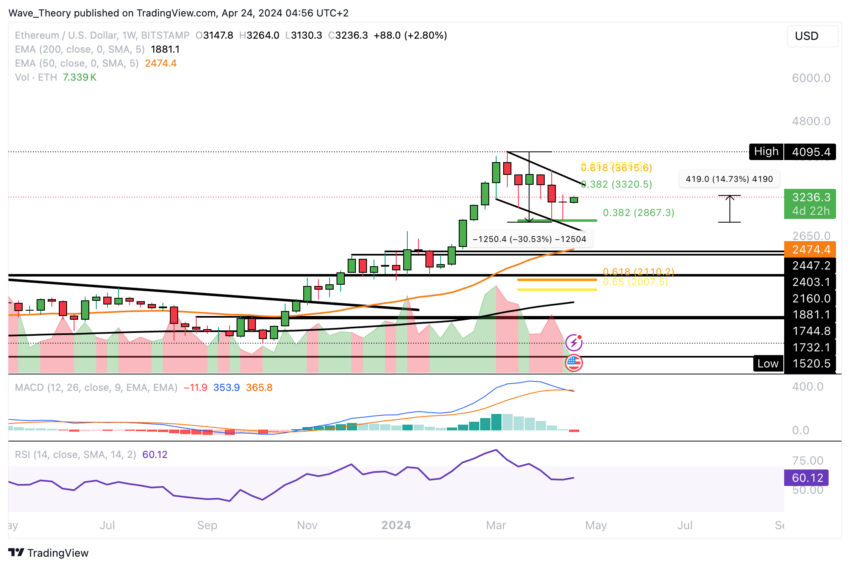
Further upward movement and price recovery for Ethereum seems plausible. However, a significant bullish signal would only manifest if Ethereum surpasses the golden ratio at approximately $3,650.
Ethereum Slides 23.7%: Analysis of This Month’s Drop
So far this month, Ethereum has experienced a decline of approximately 23.7%, which may mark the extent of its correction. Additionally, the MACD indicators in the monthly chart do not indicate any bearish signals.
Rather, the MACD lines continue to maintain a bullish stance, while the MACD histogram shows upward momentum, and the RSI remains within neutral territory. In the medium term, should Ethereum breach the 0.382 Fibonacci support level, the critical golden ratio support is anticipated to be around $2,050.
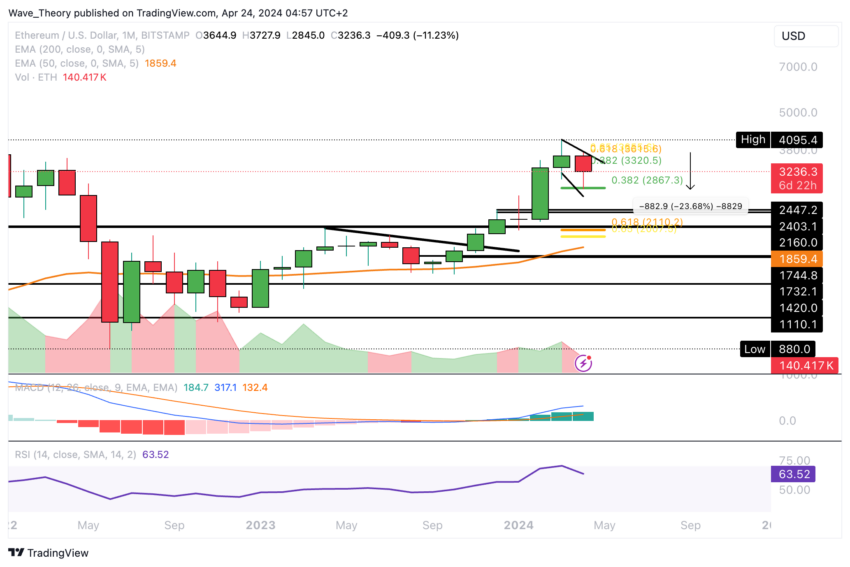
Sustaining Ethereum above this level is crucial for maintaining the bullish trajectory. However, if Ethereum were to dip below this level, significant support would be expected to materialize, potentially at the 50-month EMA of around $1,860.
Ethereum vs. Bitcoin: ETH’s Persistent Downward Trend
Against Bitcoin, Ethereum’s price trend remains bearish, with the cryptocurrency finding notable support at approximately 0.043 BTC. Ethereum is currently within a 3.5% range of this crucial support level. Moreover, the MACD histogram is displaying a downward trend this month.
Read More: Ethereum (ETH) Price Prediction 2024/2025/2030
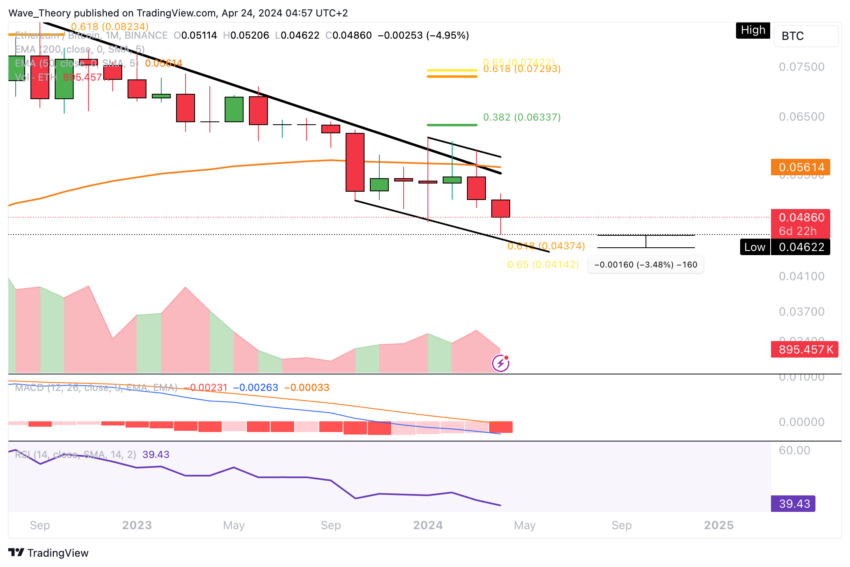
With the MACD lines already in a bearish cross and the RSI approaching oversold territory, Ethereum’s potential for a bullish rebound at the golden ratio support around 0.043 BTC is promising. Ethereum will likely face resistance at the 50-month EMA at approximately 0.05614 BTC if it achieves this.


