
This week Bitcoin touched its all-time high (ATH) of $69,000 from November 2021. After 847 days, the largest cryptocurrency has returned to the top of the previous cycle and may soon enter the price discovery territory again.
This historic event is perfect for comparing data from previous Bitcoin cycles. Long-term technical analysis of previous cycles allows us to estimate the peak of the BTC price for the current cycle and when it should be reached.
Perhaps the upcoming halving of Bitcoin is still the basis for determining the 4-year cycles of the cryptocurrency market. If so, a new bull market could take the BTC price to the $155,000 – $175,000 range, which should be reached somewhere between April and August 2025.
The Lows and Peaks of Bitcoin Historical Cycles
The first and most obvious set of data that can be obtained from historical cycles is information on the lows and peaks of the BTC price. One can estimate the likely peak of that cycle by measuring the decreasing proportion between the price range of successive cycles.
The initial uptrend, which began with BTC valued at $0.01, ended with a peak at $31.90 in June 2011. Bitcoin then plunged to a first-cycle low of $2.01 in November 2011.
This event started the bull market following the first halving (November 2012). Bitcoin price increased to the historic ATH at $1,177 in November 2013. Thus, the bull market led to an increase of 586x. This was followed by the 2014 bear market, which took the BTC price to a macro bottom at $164 in January 2015. From then until December 2017, Bitcoin again experienced a long-term uptrend.
In the meantime, there was a second BTC halving, which took place in July 2016. The peak of the BTC price was at $19,764. In the second cycle, the price of BTC increased 121x.
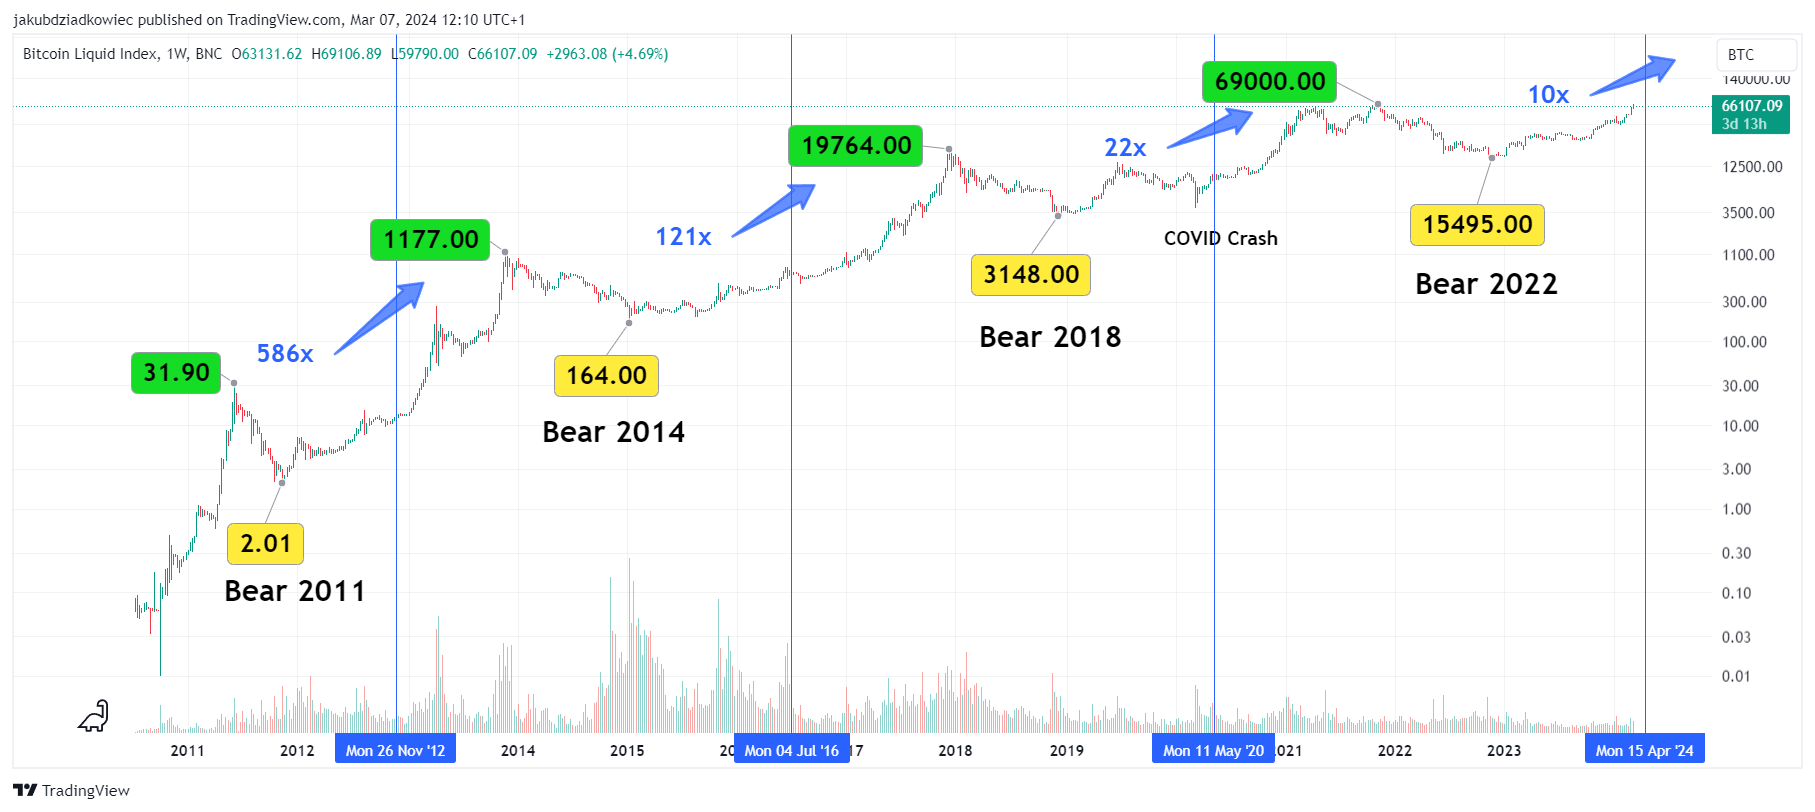
Another 2018 bear market led Bitcoin to a bottom at $3,148 in December 2018. Increases followed this slowed only by the COVID-19 crash of March 2020.
However, after the third halving (May 2020), the BTC price rose parabolic. It ended with a double peak formation and the current ATH at $69,000 in November 2021. During the third cycle, Bitcoin climbed 22x.
BTC Price Prediction Based on Cyclical Multiplier
The last known and closed macro period of BTC price history is the 2022 bear market. The largest cryptocurrency generated a macro bottom at $15,495 in November 2022. Since then, the price has been rising, and this week, it recorded ATH again.
How high will Bitcoin grow relative to its macro bottom? According to historical data, we have the following descending sequence of multipliers of successive cycles:
- cycle 1: 586x
- cycle 2: 121x
- cycle 3: 22x
- prediction for the current cycle: 10x
Thus, if the Bitcoin price were to increase by “only” 10x during this cycle, the peak would occur around $155,000. At the same time, it would be about 2.2x from the current all-time high of $69,000.
It turns out that if Bitcoin’s new peak were reached by only 2.2x above the current ATH, it would not be something unexpected. Looking at data from historical cycles, the price of BTC has been rising lower and lower above its previous ATH:
- cycle 1: 37x
- cycle 2: 16x
- cycle 3: 3.5x
- prediction for the current cycle: 2.2x
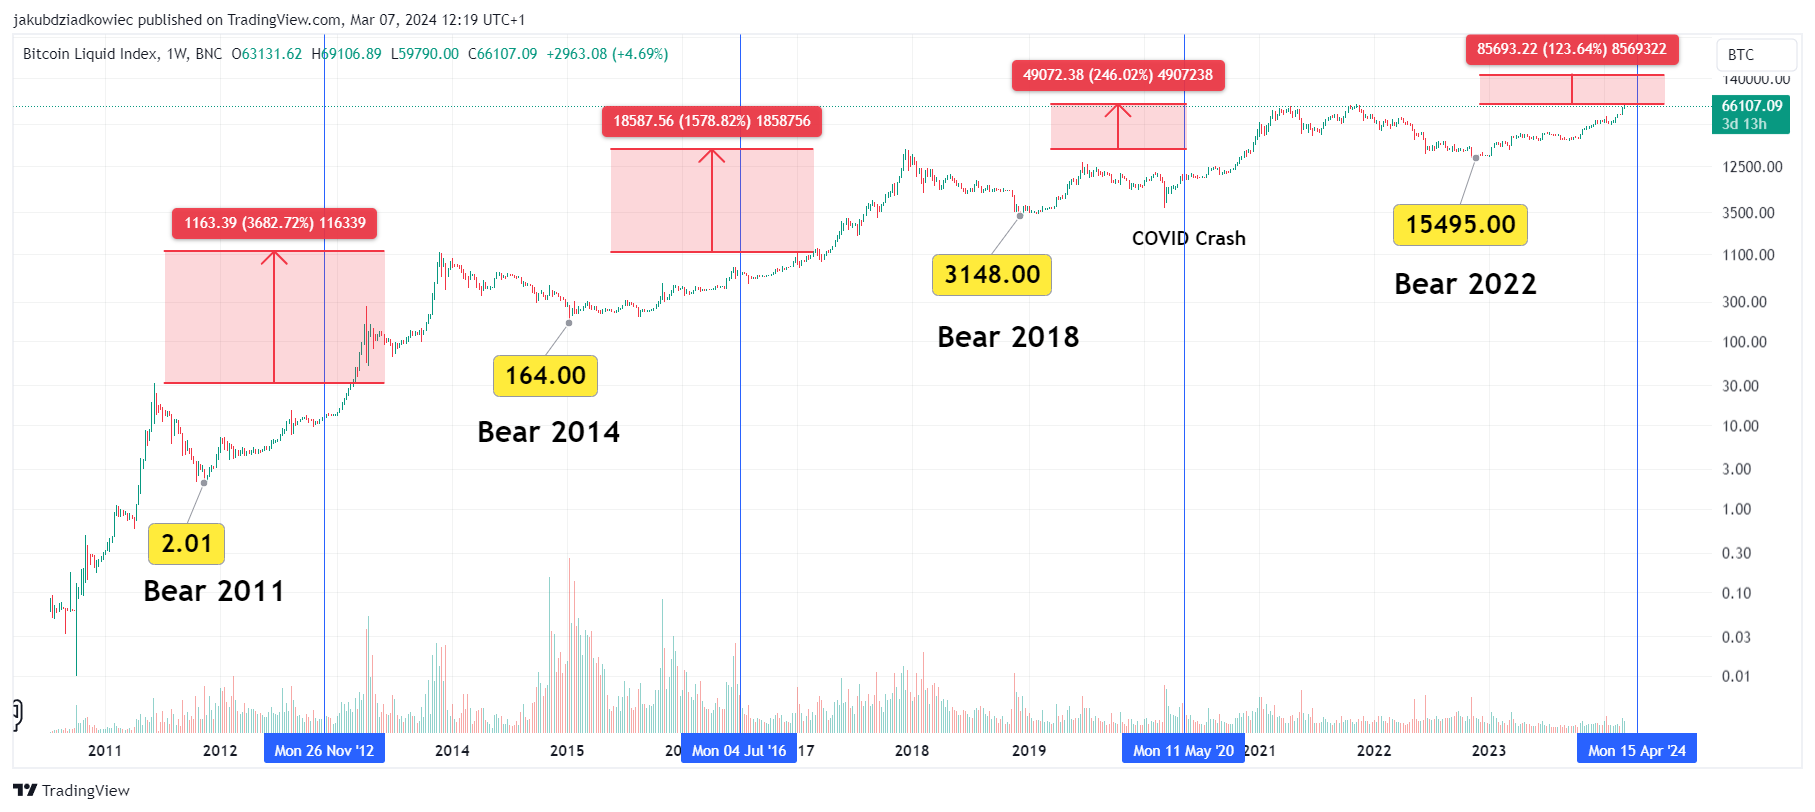
Therefore, the conservative target of $155,000 agrees with the historical multipliers of the BTC price, counting from macro lows to peaks and the increase above the previous ATH.
BTC Price Peak between April and August 2025
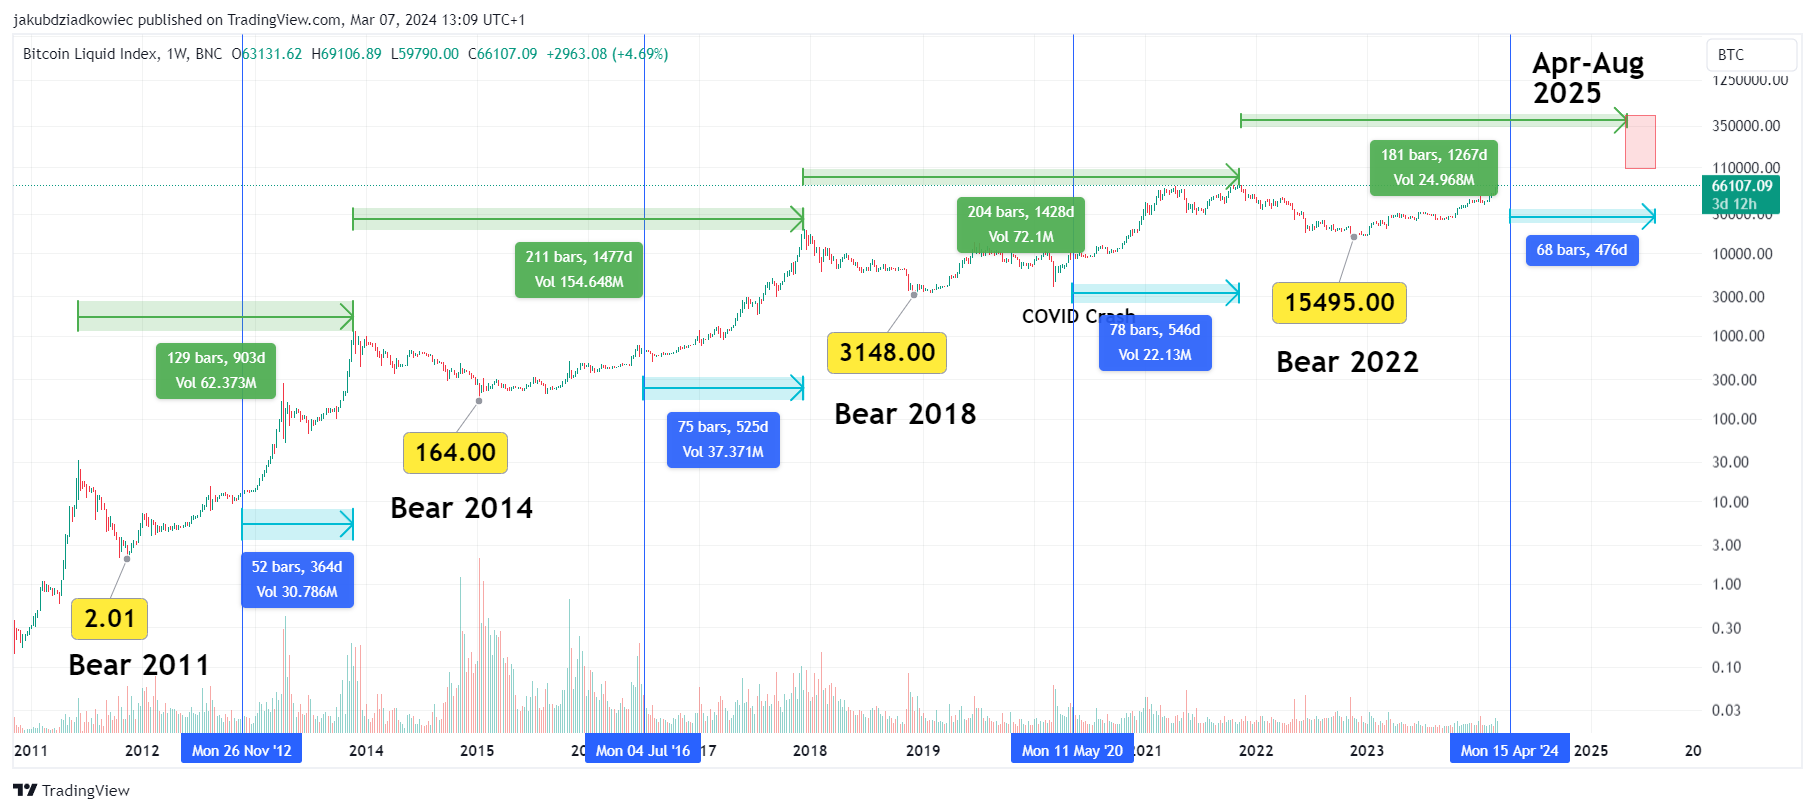
Another way to estimate the details of Bitcoin’s ongoing cycle is to measure the time after successive all-time highs were reached. This will make it possible to determine the approximate time when the cryptocurrency market will reach extreme euphoria. Such conditions are the last moment to close your positions, as the specter of a bear market is already looming on the horizon.
Here again, measurement can be done in at least two ways. The first – is by measuring from the previous all-time high to the next peak (green). The second is measuring from the halving to the all-time high (blue). By analyzing previous cycles, we get the following data:
- cycle 1: 129 weeks and 52 weeks
- cycle 2: 211 weeks and 75 weeks
- cycle 3: 204 weeks and 78 weeks
- prediction for the current cycle: 181 weeks and 68 weeks
To get the prediction for the current cycle, we extract the arithmetic average from the historical data. As a result, the date range for a potential BTC price cycle peak is from the end of April to the beginning of August 2025 (red area).
Fib Levels Suggest a Peak at $175,000
Another way to estimate the price of BTC at the end of the current cycle is to measure it based on Fibonacci (Fib) retracement levels. To do this, one measures the Fib retracement from the cycle peak to the macro bottom. The external Fib retracement above the previous all-time high is then used to determine where the BTC price has reached in the next cycle.
Again, here we find that in successive cycles, the BTC price reaches lower and lower Fib levels on the logarithmic scale. The exception, however, is the second cycle, in which the peak at $19,764 reached the 2,414 Fib level. In contrast, in the first cycle, it was slightly lower at 2,272 Fib.
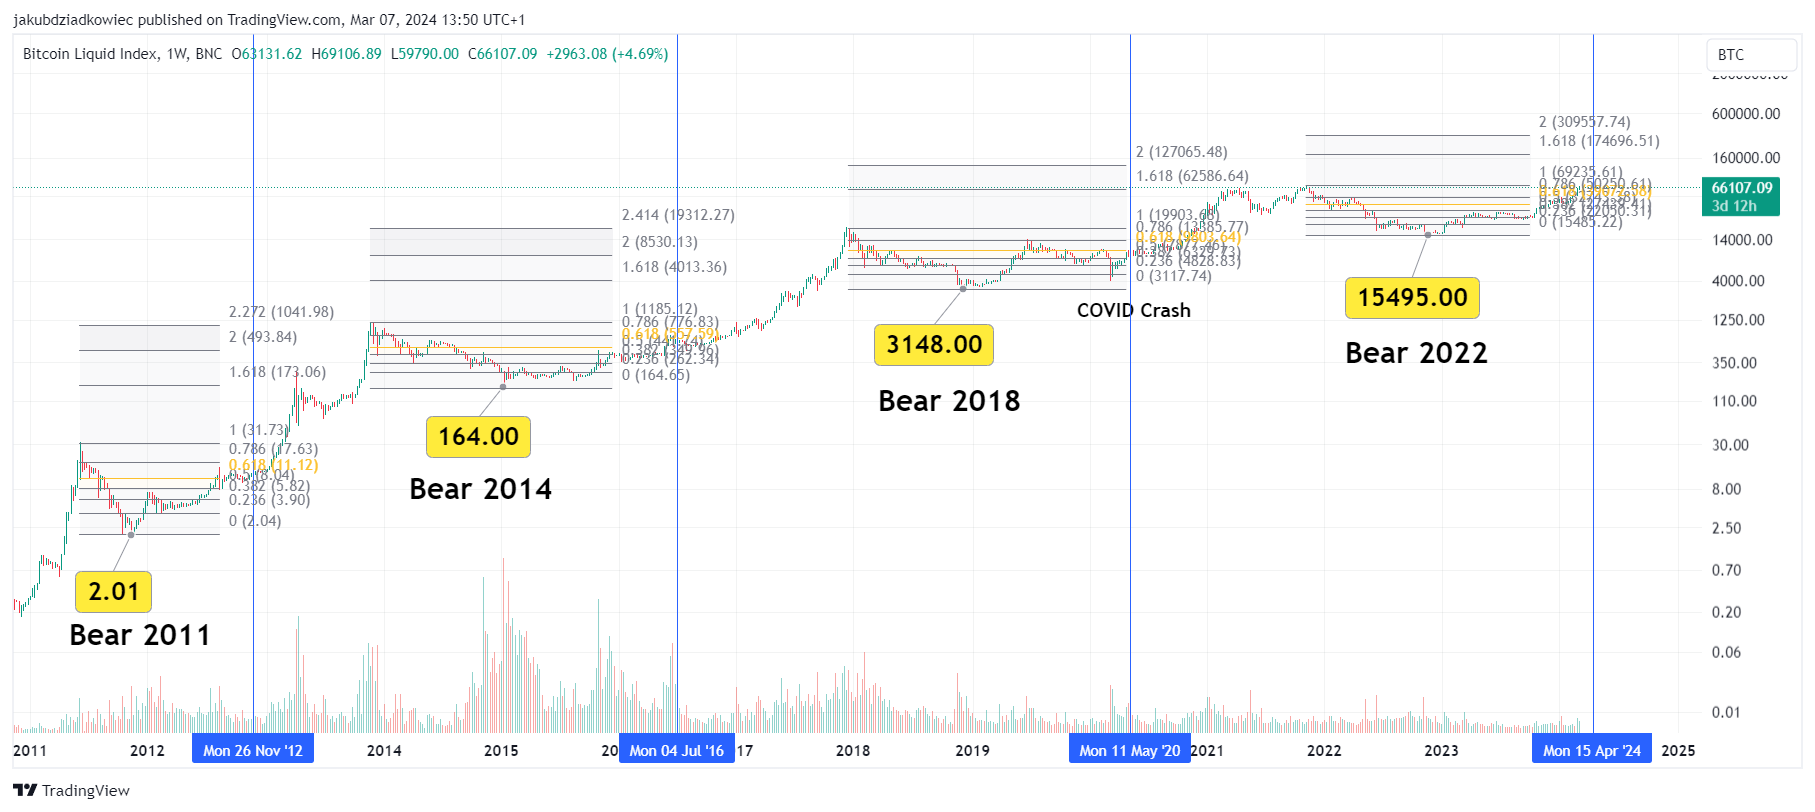
However, in the previous third cycle, the Bitcoin price only managed to reach the 1.628 Fib external retracement of the previous cycle. This is the first and most common target for price discovery phases above the historical ATH.
If this scenario were to repeat in this cycle, Bitcoin would have peaked at $175,000. However, data derived from the price multiplier of previous cycles and the increase above the previous ATH suggest a peak at $155,000.
Therefore, we conclude that the range of $155,000 – $175,000 is the most likely target for a new all-time high for this cycle of the Bitcoin market. At the same time, if the temporal similarities with previous cycles are maintained, this will happen somewhere between April and August 2025.
For BeInCrypto’s latest crypto market analysis, click here.


