
The Dogecoin price is indeed experiencing a significant surge. Whether it will double in price depends on various factors, including market sentiment and external events.
The indicators currently suggest bullish momentum, with a golden crossover of the Exponential Moving Averages (EMAs) in Dogecoin’s weekly chart indicating a bullish trend in the medium term. Additionally, Dogecoin has shown impressive gains against Bitcoin, rising approximately 67.5% since February, despite Bitcoin’s potential for a new all-time high (ATH).
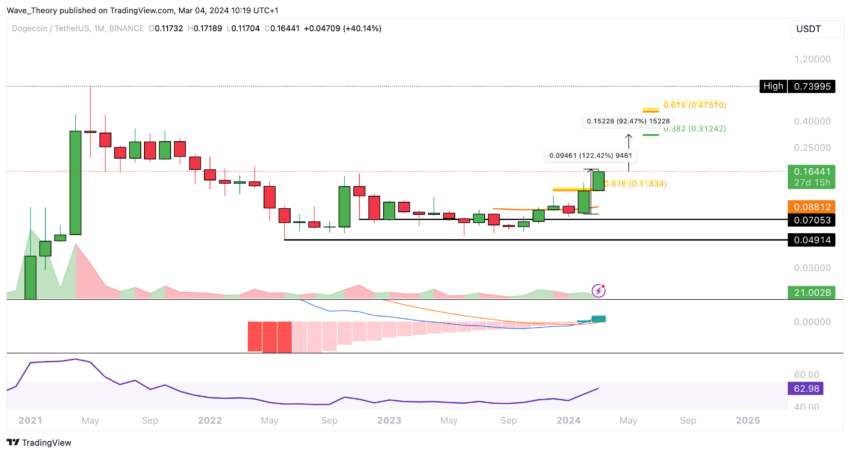
Dogecoin Jumps 122.4% in February – Will the Trend Continue?
Dogecoin has experienced a remarkable surge in just over a month, marking a 122% increase in price. Breaking the golden ratio resistance at around $0.12 has paved the way for further gains, with significant Fibonacci resistances now at $0.31 and $0.48, suggesting a potential upside of 93%.
A breakthrough at $0.48 would signal a new bullish trend, potentially propelling Dogecoin to surpass its all-time high of around $0.74. The monthly Moving Average Convergence/Divergence (MACD) histogram indicates an uptrend, with the bullish crossover of MACD lines, while the RSI remains neutral.
Golden Crossover Confirmed in Weekly Chart
The weekly chart for Dogecoin reveals a bullish outlook as the EMAs have formed a golden crossover, confirming the medium-term trend. Additionally, the MACD lines are crossed in a bullish manner, and the MACD histogram is showing bullish momentum.
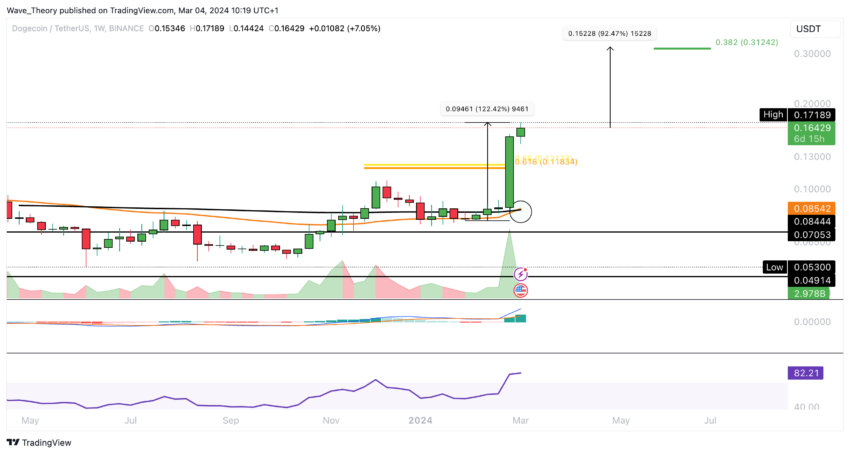
Despite the strong bullish performance last week, caution is advised as the Relative Strength Index (RSI) indicator is now in overbought regions on the weekly chart. However, it’s important to note that there is no clear bearish divergence observed in the RSI.
Bullish Signals in Dogecoin’s Daily Chart
On the daily chart, Dogecoin also exhibits a bullish trend, confirmed by a golden crossover of the EMAs, indicating short to medium-term bullishness. The MACD histogram displays upward momentum, and the MACD lines are crossed bullishly.
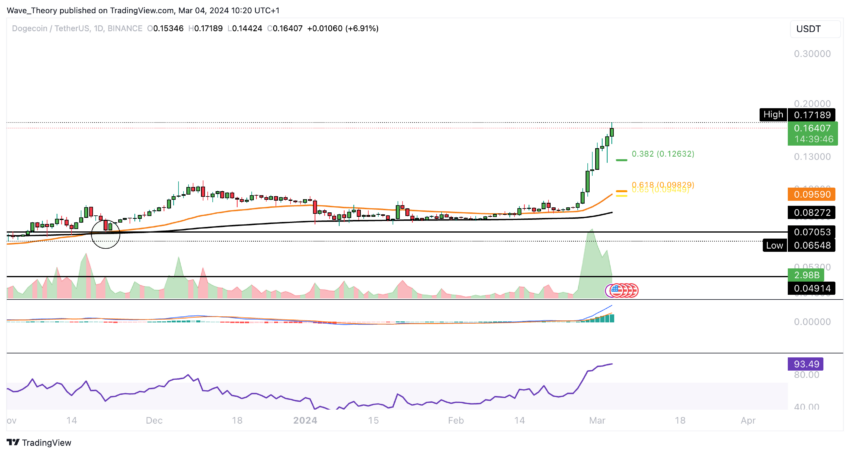
However, caution is warranted as the RSI indicates heavily overbought conditions. Nonetheless, there are no indications of a bearish divergence at this point.
Emerging Bearish Divergence on Dogecoin’s 4H Chart
On Dogecoin’s 4-hour chart, a bearish divergence is noticeable amidst the parallel upward channel. However, the MACD lines remain crossed bullishly, and the MACD histogram shows upward momentum.
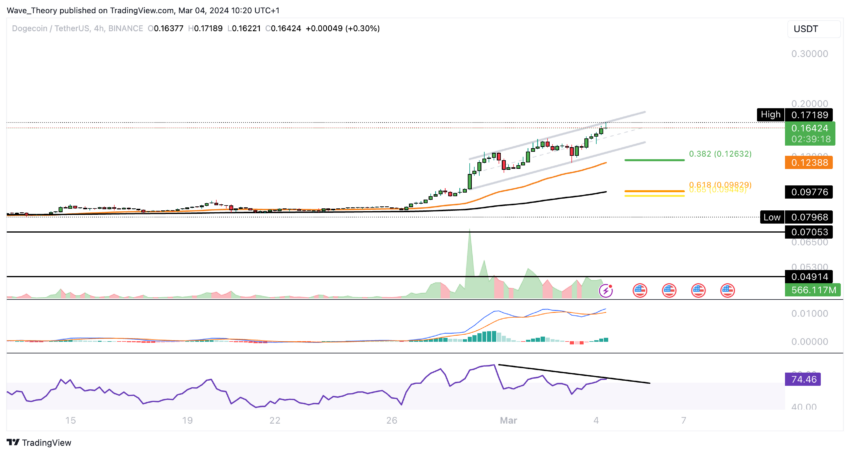
Moreover, a golden crossover supports the short-term bullish trend. If a correction occurs, significant Fibonacci supports await around $0.1263 and $0.098, with additional support from the 50-4H and 200-4H EMAs.
DOGE Price Up 67.5% vs. BTC: What’s Next?
Despite a recent death cross against Bitcoin indicating a medium-term bearish trend, Dogecoin has shown significant strength against BTC, surging over 67.5% in the past week. The MACD histogram has turned bullish, MACD lines have crossed upwards, and the RSI is in neutral territory.
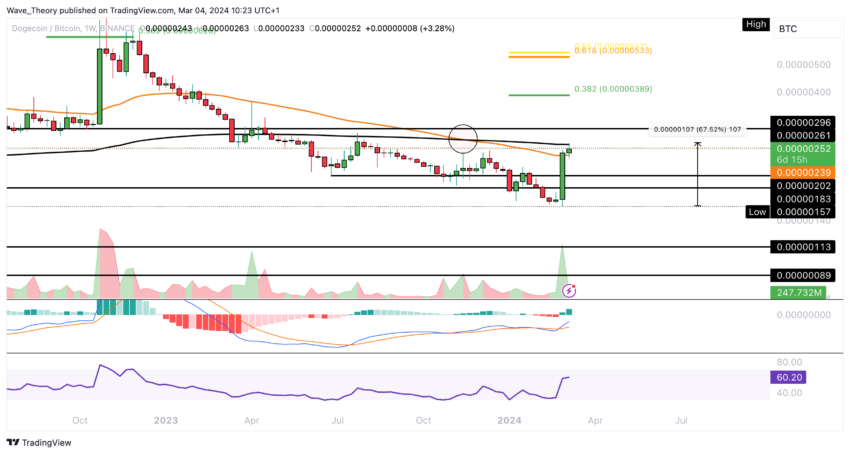
Currently encountering resistance at the 200-week EMA around 0.00000261 BTC, a successful break could lead Dogecoin towards the next Fibonacci resistances at approximately 0.00000389 BTC and 0.00000533 BTC.


