
Recently, there’s been a noticeable stagnation in the growth of active addresses using MATIC, unlike the steady increase observed just a few weeks earlier. Whales have steadily reduced their MATIC holdings in the last two weeks, contributing to potential market volatility.
This situation, coupled with the presence of weak support levels, could exacerbate the downward pressure on MATIC’s price, possibly leading to a further decline.
Daily Active Addresses Slowing in Growth
From February 13 to March 7, the count of Daily Active Addresses engaging with MATIC witnessed a significant jump, escalating from 2,468 to 3,275. This shift indicates a notable growth rate of 32.70% within a span of just three weeks.
However, the momentum of this growth began to wane after March 7, as evidenced by the declining trend in the 7-day Moving Average depicted in the accompanying chart.
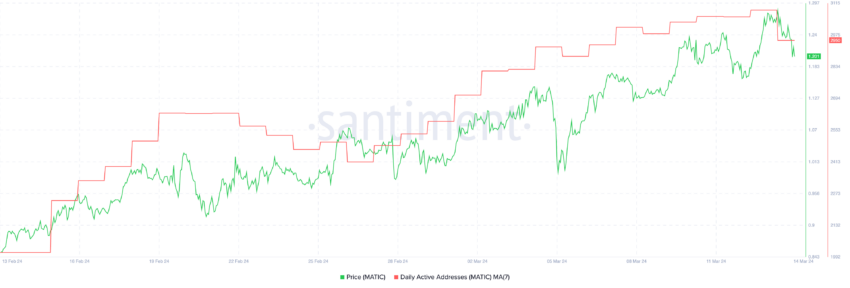
It’s particularly interesting to observe the historical correlation between the increase in daily active addresses and the price movements of MATIC.
Given the recent plateau in the growth of daily active addresses, it hints at a forthcoming period where MATIC’s price might experience a phase of stabilization. Such a trend suggests that, after a period of significant activity, the price of MATIC could be gearing up for a more settled phase, potentially hinting at reduced volatility in the near future.
Whales Have Been Offloading Their Holdings
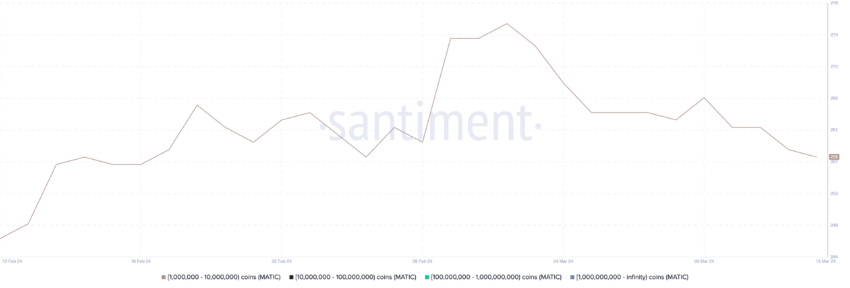
The number of addresses holding at least 1,000,000 MATIC is also decreasing. On March 2, it reached its all-time high, with 276 MATIC whales. However, since that day, the number of whales has decreased to 258 on March 14.
In that same period, MATIC’s price only grew 10%, way less than other coins. This suggests that maybe these whales are leaving MATIC to focus on other coins they believe can perform better.
Comparing the year-to-date (YTD) growth of some of the biggest crypto in the market today – excluding stablecoins and memecoins, MATIC was outperformed by 18 out of 20. It only outperformed the YTD gains of XRP and ICP.
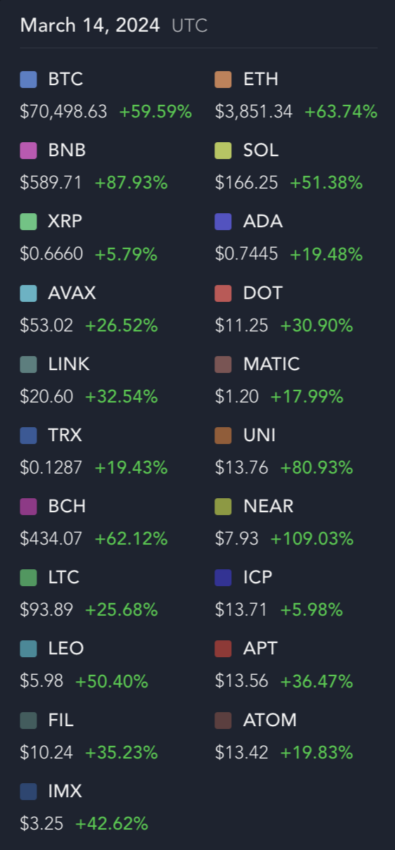
With the market booming right now, investors could be moving their money and choosing other coins to bet, thinking they could obtain bigger returns on their investment compared with MATIC, especially after it rose from $1.18 to $1.27 in just one day.
MATIC Price Prediction: Will MATIC Sustain Its Support?
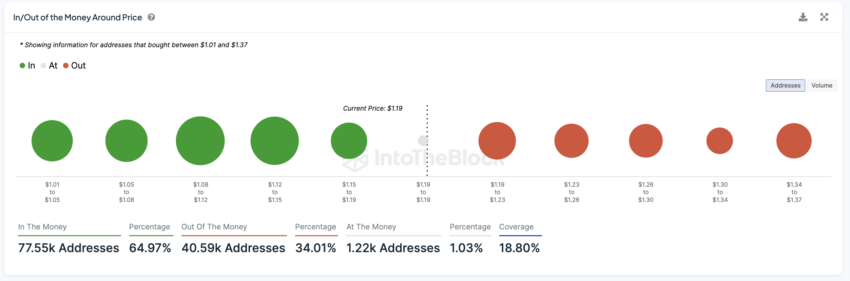
When examining the In/Out of the Money Around Price (IOMAP) chart for MATIC, it’s evident that the cryptocurrency finds substantial support at the $1.15 level. However, should it fail to maintain this level, there’s a risk of a decline to as low as $1.12 or even $1.08. When MATIC embarks on a sustained downtrend, it might even plummet to the $1.01 price range.
The In/Out of the Money Around Price (IOMAP) chart is an analytical tool used to visualize clusters of investor positions relative to the current price of an asset. It identifies the price levels at which large amounts of buy or sell orders are concentrated, effectively mapping out significant support and resistance levels based on real investor holdings.
By analyzing the distribution of these positions, the IOMAP can reveal where investors might experience losses (out of the money) or gains (in the money) if the asset’s price moves to different levels.
The IOMAP provides a snapshot of market sentiment and potential future price behavior by highlighting key levels where price action could stall or reverse due to collective investor behavior.
Conversely, if MATIC successfully overcomes the resistance levels at $1.19 and $1.23, there’s potential for an upward trajectory towards $1.34 in the forthcoming days. Such a move would mark its highest valuation since April 2022, showcasing a significant recovery and bullish momentum for the coin.
This analysis highlights the critical price points that could determine MATIC’s short-term market movements, reflecting the risks and opportunities ahead.


