 .10?" alt="Dogecoin (DOGE) Price Prediction: What Lies Above $0.10?" width="850" height="478" />
The Dogecoin (DOGE) price broke out from long- and short-term diagonal resistance levels, moving above $0.100 today.
DOGE is approaching a critical horizontal resistance area which has existed for more than a year. Will it break out?
Dogecoin Approaches Pivotal Level
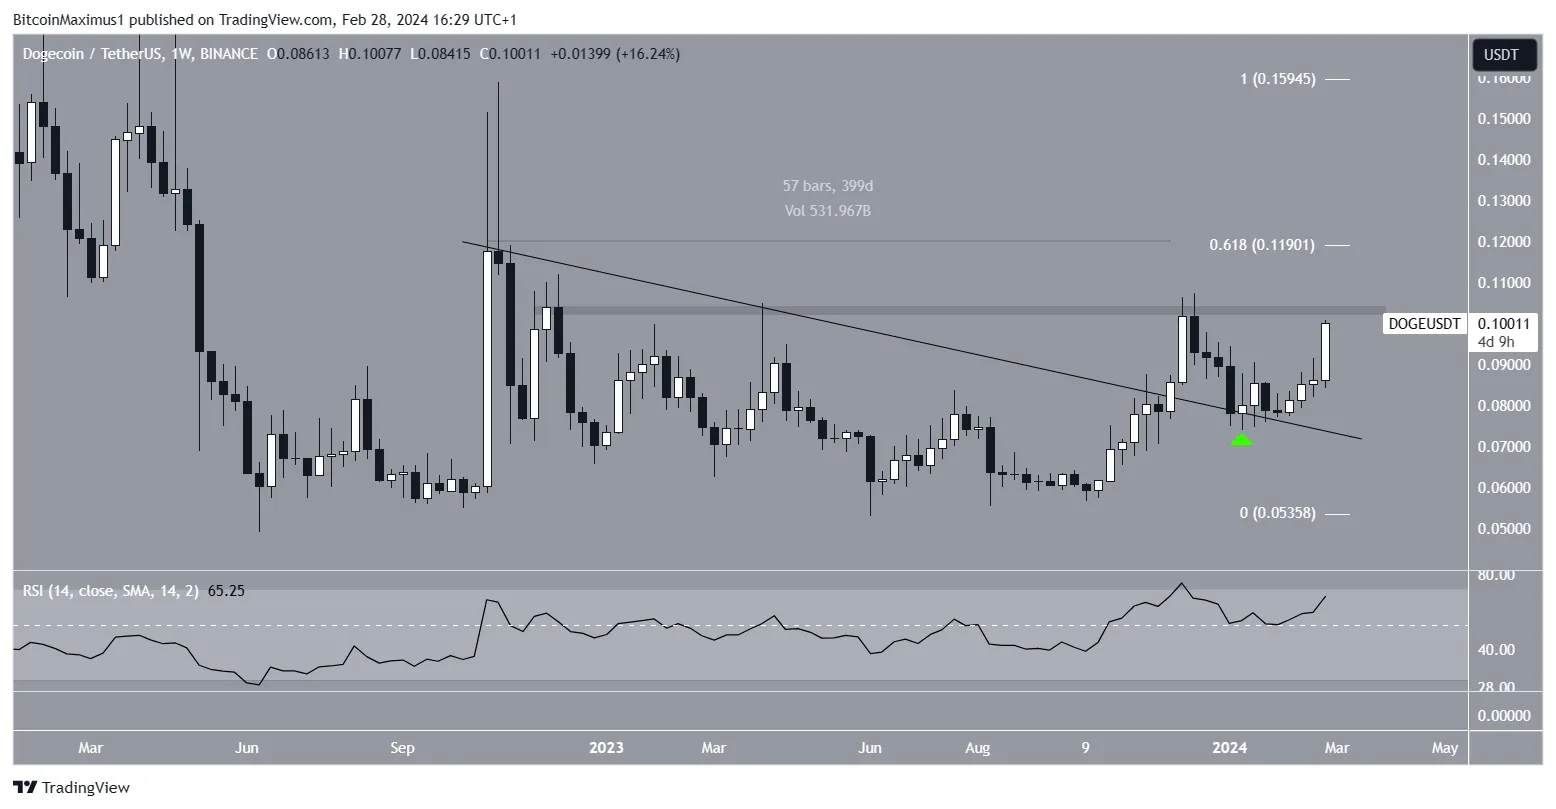
The weekly time frame technical analysis shows the DOGE price broke out from a long-term descending resistance trend line in November 2023. The upward movement led to a new yearly high of $0.108 next month. Howevver, the DOGE price has fallen since.
In January 2024, DOGE returned to the descending resistance trend line (green icon) and bounced. The Dogecoin price has moved upwards since but has yet to break above its 2023 highs.
 .10?" />
The weekly Relative Strength Index (RSI) gives a bullish reading. When evaluating market conditions, traders use the RSI as a momentum indicator to determine whether a market is overbought or oversold and whether to accumulate or sell an asset. The RSI is above 50 and increasing, both signs of a bullish trend.
DOGE Price Prediction: What Happens After the Breakout?
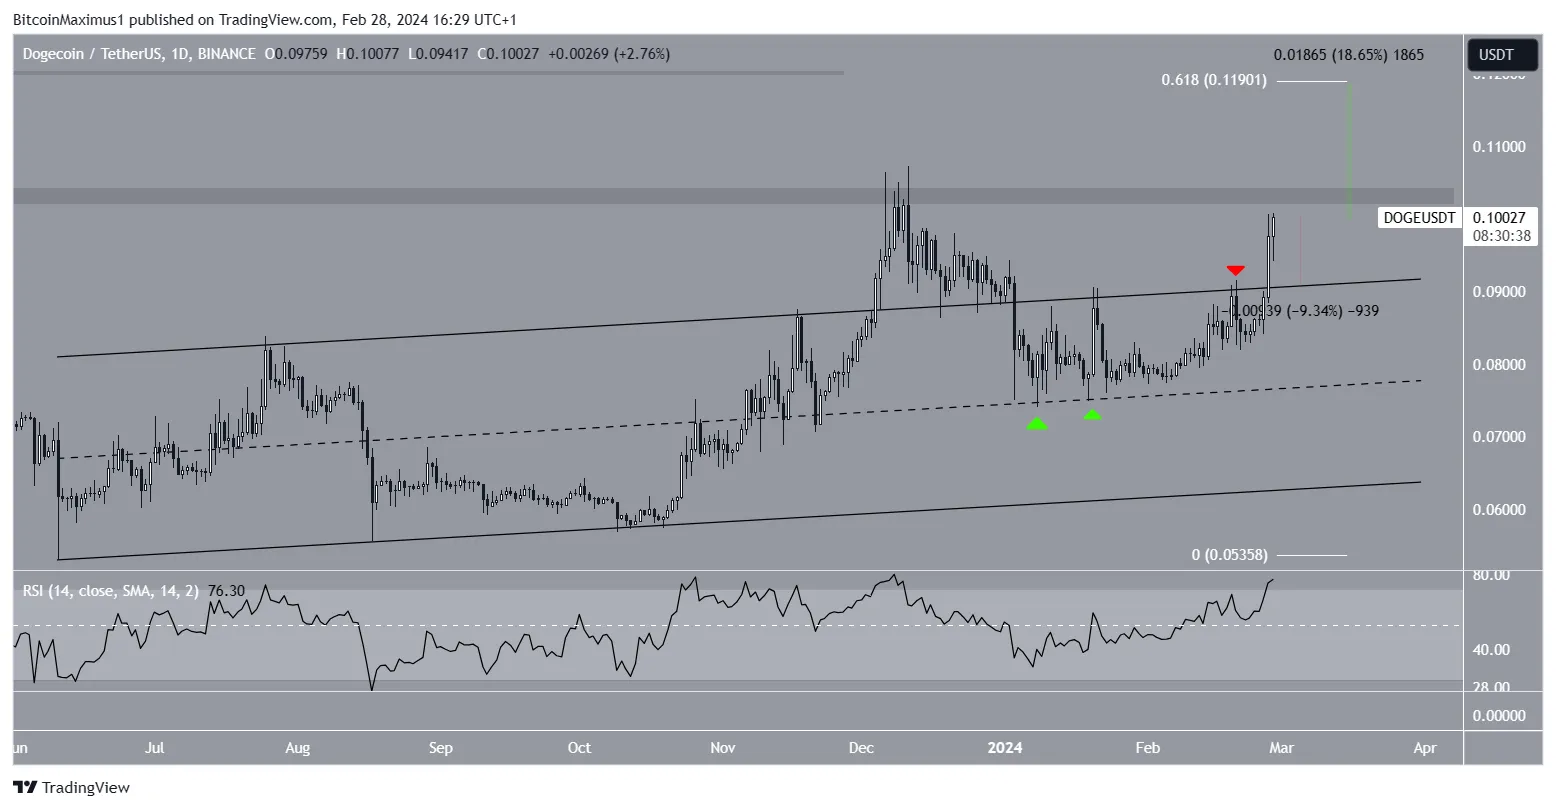
The daily chart shows that DOGE has increased since bouncing at the midline of an ascending parallel channel on January 8. It broke out from an ascending parallel channel yesterday and finally moved above $0.100 today.
The daily RSI supports this increase since the indicator is trending upward and is above 70.
If DOGE breaks out from its main resistance at $0.105, it can increase by another 18% and reach the next one at $0.119.
 .10?" />
Despite the bullish DOGE price prediction, a rejection from the $0.105 area can trigger an 9% decrease to the channel’s resistance trend line at $0.090.
For BeInCrypto‘s latest crypto market analysis, click here


