Time is running out until Bitcoin’s fourth halving. As early as April 2024, there will be a reduction in the reward for miners from 6.25 BTC to 3.125 BTC for mining a block. According to some analysts of the cryptocurrency market, the current period is the best time to accumulate and use the strategy of dollar cost averaging (DCA).
Moreover, if history rhymes and the supply shock affects the economics and valuation of Bitcoin again, the largest cryptocurrency could soon experience a parabolic surge. Typically, periods of 12-18 months after a halving have been characterized by a large appreciation in the BTC price.
$120,000 Bitcoin at Peak of Upcoming Bull Market
Renowned cryptocurrency market analyst @Negentropic_ published his macro technical analysis of the BTC price chart on X. At the beginning, he referenced a quote from Mark Twain that is well-known in the cryptocurrency world: “History does not repeat itself – but it often rhymes.”
This saying, in relation to traditional financial markets and cryptocurrencies, points to their cyclical and fractal nature. While many of the determinants of an asset’s price differ in successive eras of its trading history, very similar macroscopic price patterns can often be identified.
@Negentropic_ points to one pattern he has noticed in 3 consecutive Bitcoin cycles. Namely, in his view, in 2017, 2020, and currently, Bitcoin underwent a similar correction in the form of a bull flag. These corrections were relatively small and, at the same time, were the last opportunity to buy BTC before the parabolic surge that followed.
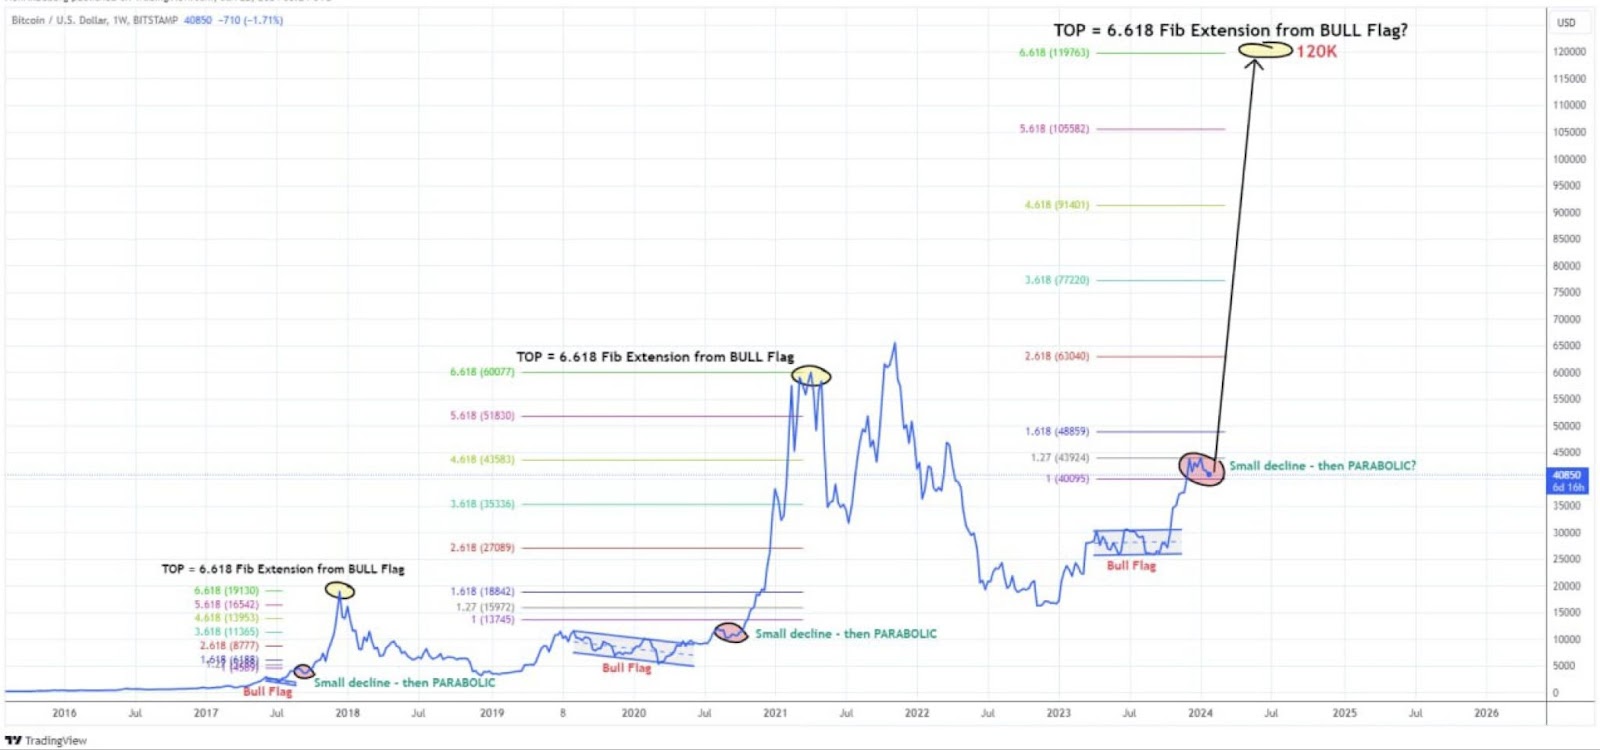
The analyst uses the external Fib retracement to establish a potential target for Bitcoin’s increase in the current cycle. He observed that in both previous cycles, the bull market peak was reached at the 6,618 Fib extension. Thus, if history were to rhyme, the $120,000 level would provide a target for the BTC price.
90 Days to Halving is the Best Time for DCA
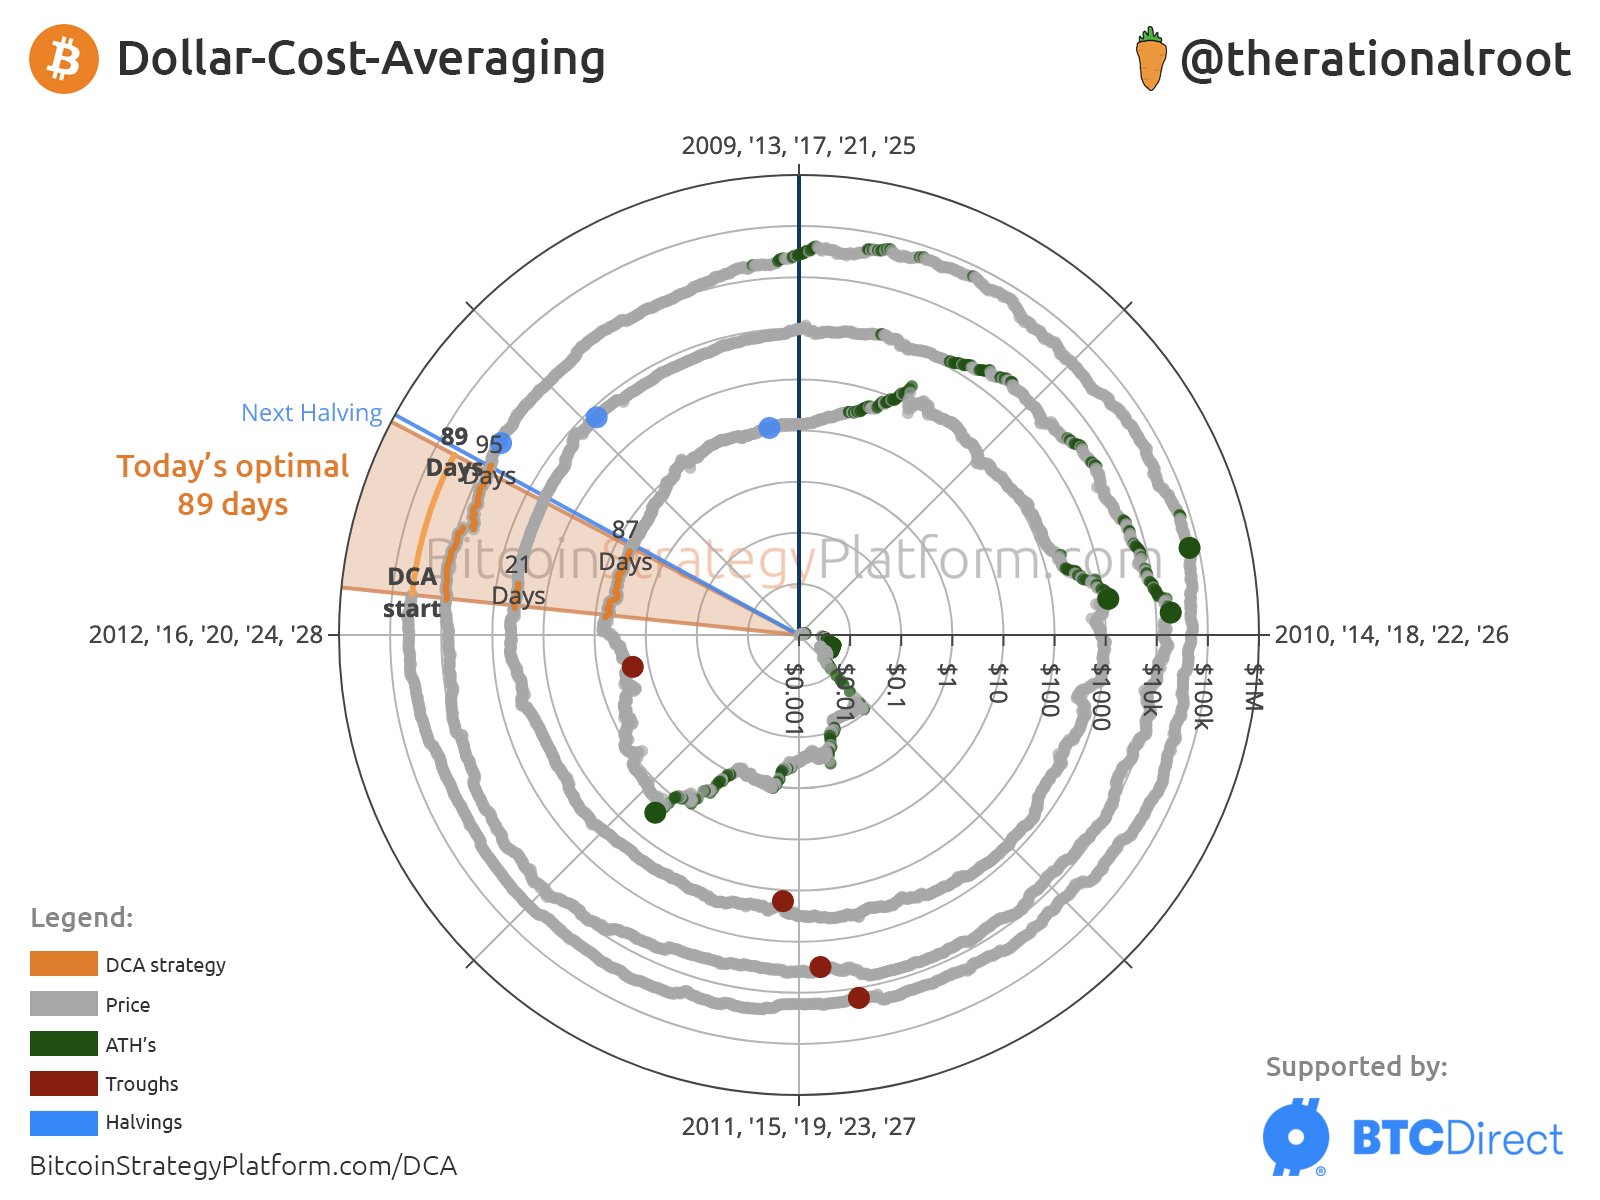
Regardless of the detailed prediction of the Bitcoin price at the peak of the coming bull market, it seems that the current correction could be an excellent buying opportunity. Another analyst, @therationalroot, argues that the period of around three months before halving represents the best opportunity to use a dollar-cost averaging (DCA) strategy.
He uses his circular chart of Bitcoin cycles to determine this optimal period to buy BTC. It turns out that historically, it is the last 89 before halving that have been the best opportunity to use DCA (orange area). According to the latest data, Bitcoin’s halving will occur on April 18, 2024 – or 83 days from now. The analyst states:
“Those adopting an 89-day DCA, even at the least opportune moment, were in profit within 3 years!”
Just to be safe, @therationalroot adds that “historical performance doesn’t assure future results.” Therefore, even as the history and cyclicality of the Bitcoin price rhyme, an alternative scenario or a totally unpredictable black swan-style market structure is always possible.
For BeInCrypto’s latest crypto market analysis, click here.


