
Four months ago, Nvidia (NVDA) shares fell short of reaching the $500 milestone. Currently, the price of Nvidia is once again rallying towards this significant level.
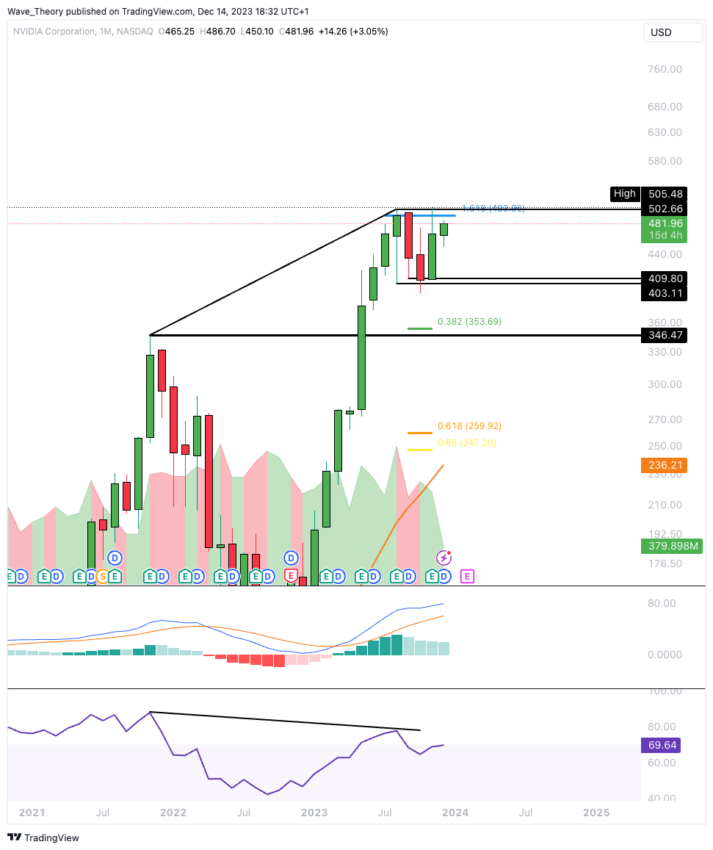
The critical question now is whether Nvidia’s stock price will successfully surpass the crucial Fibonacci (Fib) resistance at the $500 mark. This level is pivotal, as a successful breach could signal a strong bullish momentum. On the other hand, there is the possibility of another bearish rejection at this threshold, which could lead to a pullback or consolidation in the stock price.
Is Nvidia Poised to Break the $493 Fibonacci Resistance?
If Nvidia’s stock price successfully overcomes the Fibonacci (Fib) resistance level at approximately $493, it may potentially surpass its previous high of around $505.
However, the technical indicators present a mixed outlook. The Moving Average Convergence Divergence (MACD) histogram has been trending downwards in a bearish pattern for the past four months, although the MACD lines are still in a bullish crossover. Significantly, the Relative Strength Index (RSI) is indicating a massive bearish divergence, a signal that was reflected in the stock’s performance four months ago.
During September and October, Nvidia’s stock experienced a decline of about 21%. It then found support in the range of $403 to $410, leading to a rebound that is bringing the price back towards the Fib resistance at around $493.
If Nvidia manages to break through this resistance level with bullish momentum, the stock could be poised to reach a new all-time high. This is assuming market conditions and company fundamentals remain favorable. This scenario underscores the dynamic nature of stock market movements. This is influenced by a blend of technical indicators and broader market factors.
Nvidia’s Weekly Chart Shows Bearish Divergence in RSI
In Nvidia’s weekly chart, there is a mix of bullish and bearish signals. On the bearish side, the Moving Average Convergence Divergence (MACD) lines are in a bearish crossover, and the Relative Strength Index (RSI) indicates a bearish divergence.
However, there are bullish indicators as well. Notably, the MACD histogram has started ticking upward bullishly since last week, and the Exponential Moving Averages (EMAs) exhibit a golden crossover. These signals suggest that the medium-term trend for Nvidia remains bullish.
If Nvidia faces a bearish rejection at the Fibonacci (Fib) resistance just below the $500 mark and subsequently breaks through the support zone between approximately $403 and $410, it may find its next significant support at the 50-week EMA, around $378.
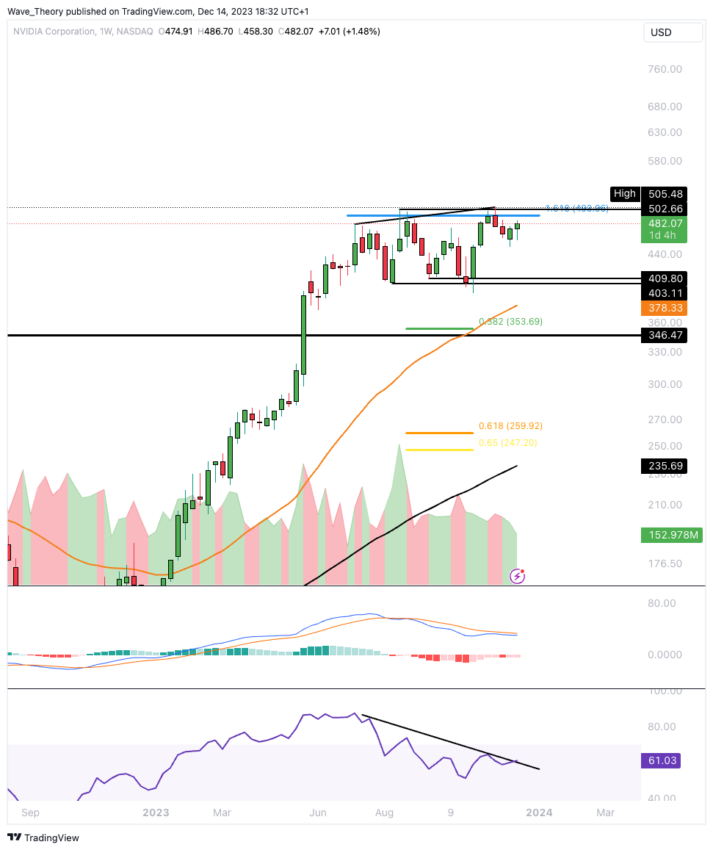
Should the price fall further, the next notable Fib support levels are anticipated to be around $354 and, more substantially, around $255. These levels could be critical junctures for potential rebounds or further price corrections.
Nvidia Daily Chart Reveals Emerging Bullish Price Pattern
In the daily chart for Nvidia, the technical indicators largely signal bullish momentum. The Relative Strength Index (RSI) is neutral, suggesting a balanced market condition without strong overbought or oversold signals. The Moving Average Convergence Divergence (MACD) lines are nearing a bullish crossover. While the MACD histogram is showing an upward trend, both indicative of potential bullish momentum.
Additionally, the golden crossover of the Exponential Moving Averages (EMAs) further confirms a bullish trend in the short to medium term. This crossover occurs when a shorter-term EMA (like the 50-day EMA) crosses above a longer-term EMA (such as the 200-day EMA). This is often interpreted as a bullish signal.
An interesting development in the daily chart is the emergence of a bullish price pattern. More specifically, it is an “inverse head and shoulders” pattern. This pattern is typically seen as a bullish reversal indicator. If Nvidia’s stock price rises above $540, it could confirm a bullish breakout from this pattern. This could potentially lead to further upward price movement.
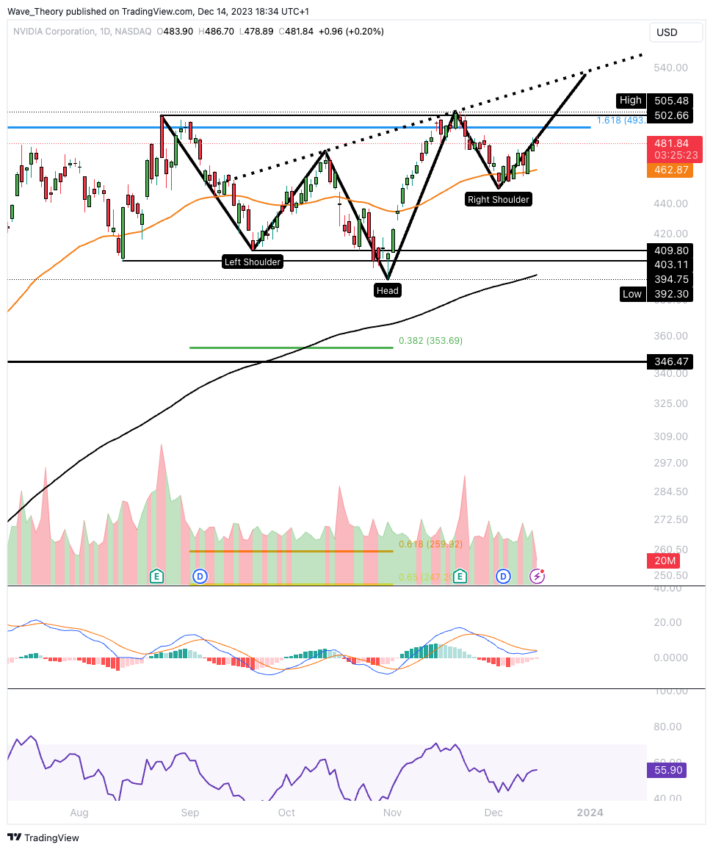
The inverse head and shoulders pattern, combined with the other bullish indicators, suggests a favorable outlook for Nvidia in the short to medium term. However, this depends on the stock’s ability to breach the key price level of $540.
Nvidia’s 4H Chart Analysis: Indicators Point to Bullish Trend
In the 4-hour (4H) chart for Nvidia, the trend is predominantly bullish, as evidenced by several key indicators. The golden crossover of the Exponential Moving Averages (EMAs) is a significant bullish signal. This crossover occurs when a shorter-term EMA (like the 50-period EMA) crosses above a longer-term EMA (such as the 200-period EMA), suggesting upward momentum.
Additionally, the Moving Average Convergence Divergence (MACD) histogram is trending upwards. Further indicating increasing bullish momentum, and the MACD lines are in a bullish crossover, reinforcing this positive trend.
The Relative Strength Index (RSI), on the other hand, is in neutral territory. This neutrality indicates a balance in the market. But with no strong overbought or oversold conditions, and provides neither distinctly bullish nor bearish signals at this time.
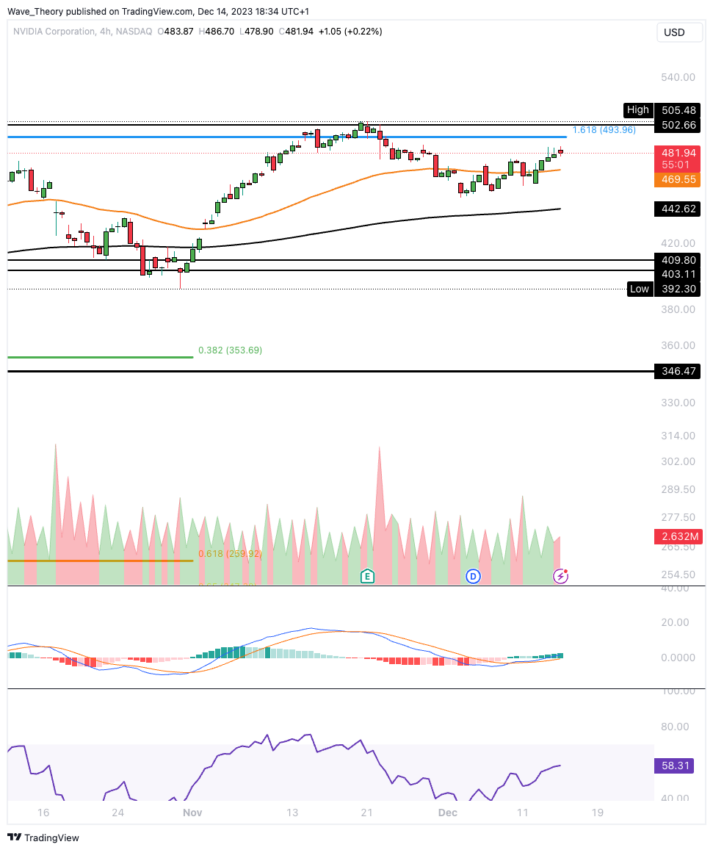
Overall, combining a bullish MACD and a golden crossover in the EMAs, along with a neutral RSI, presents a generally bullish outlook in the 4H chart for Nvidia, suggesting a favorable short-term trend.
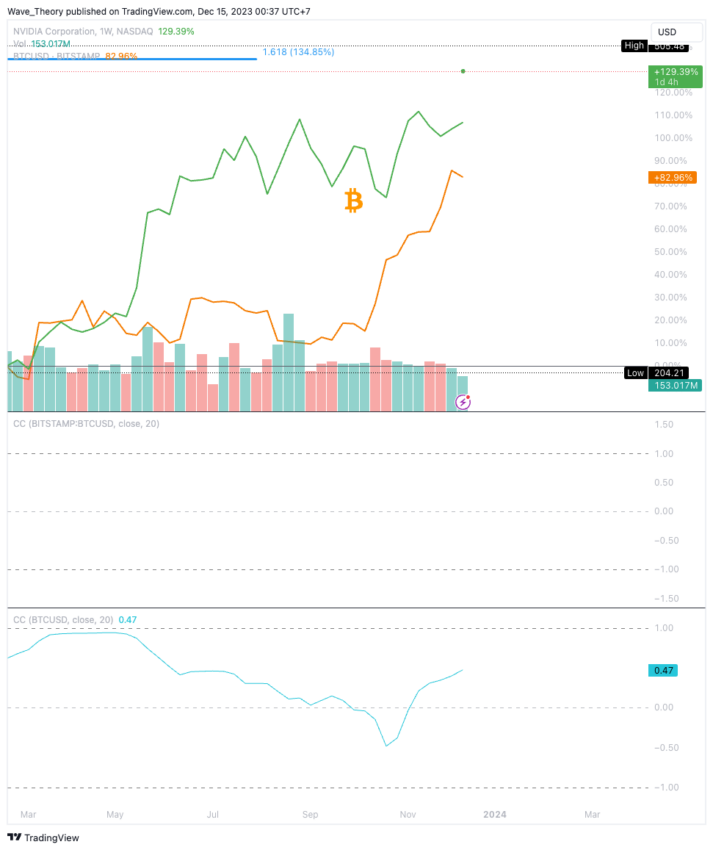
Rising Correlation Observed Between Bitcoin and Nvidia
Currently, the correlation between Bitcoin and Nvidia stock prices is moderate but has seen a notable increase in recent weeks. Currently standing at approximately 0.47. This positive correlation coefficient indicates that the price movements of Bitcoin and Nvidia have been somewhat aligned. Both have been moving in a similar direction to a moderate extent.
It’s important to note that a correlation coefficient of 0.47, while significant, does not imply a very strong relationship. It suggests that while there is some level of synchronization in their price movements. However, they are not heavily dependent on each other.
Historically, there have been periods where the correlation between Bitcoin and Nvidia was more pronounced. This stronger correlation in the past could be attributed to various factors, including market sentiment, technological developments, or investment patterns that linked the performance of cryptocurrency markets, particularly Bitcoin, with tech stocks like Nvidia.
However, correlation levels can fluctuate over time due to changing market dynamics, economic conditions, and investor behavior.


