
The potential for a bullish breakout in Dogecoin (DOGE) price remains, yet this week’s trend seems to be leaning towards a sharp correction. This current correction raises a critical question: Can Dogecoin maintain its value above the support level, or is it poised to descend to a lower level?
While the immediate trend appears corrective, the prospect of Dogecoin reaching a new high cannot be ruled out. The cryptocurrency market is known for its volatility and rapid shifts in momentum.
The ability of DOGE to either sustain its value above the support level or to rebound after a drop will be key in determining its short-term trajectory and whether it can achieve new highs in the near future.
Dogecoin Eyes $0.093, 0.382 Fibonacci Level Breakout This Month
This month, DOGE has the potential to surpass the 0.382 Fibonacci (Fib) resistance level, which is around $0.093. If this resistance is successfully broken, Dogecoin could ascend towards the golden ratio level, approximately at $0.12. This movement would represent an upside potential of around 29%.
Supporting this bullish outlook, the Moving Average Convergence Divergence (MACD) histogram in the monthly chart is trending upwards bullishly. Additionally, the MACD lines are also nearing a bullish crossover. Meanwhile, the Relative Strength Index (RSI) is currently positioned in the neutral zone, not indicating a clear directional bias either for bullish or bearish momentum.
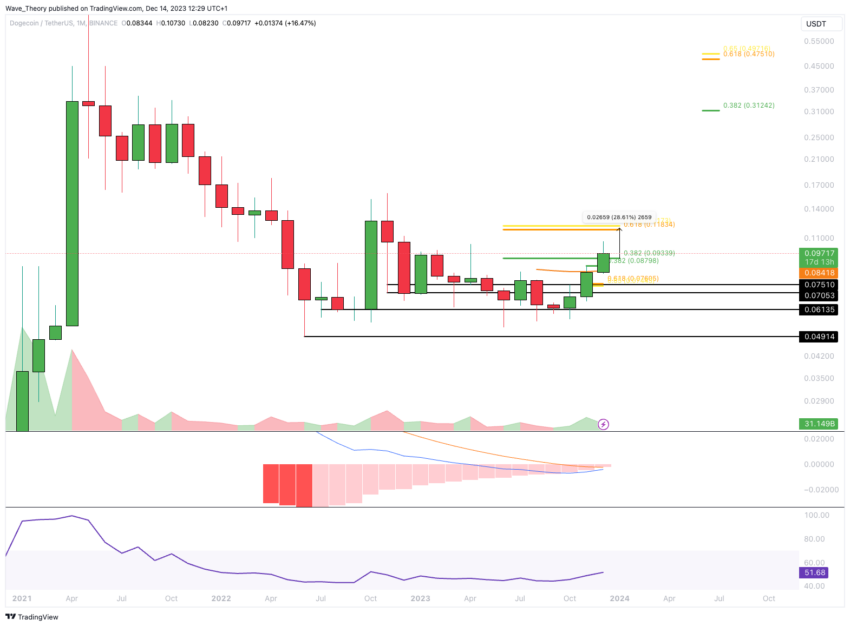
This combination of a bullish MACD and a neutral RSI suggests that while there’s potential for upward movement, the market is still balancing these bullish indications with a degree of caution and neutrality.
Dogecoin Price Dips 16.3% This Week: A Notable Decline
This week, DOGE has entered a corrective phase, resulting in a price decline of approximately 16.3%.
On the weekly chart, the Moving Average Convergence Divergence (MACD) histogram is still ticking upwards bullishly. However, the Relative Strength Index (RSI) is approaching overbought territory, suggesting a potential for a pullback or consolidation. Meanwhile, the Exponential Moving Averages (EMAs) exhibit a death cross, indicating that the medium-term trend remains bearish.
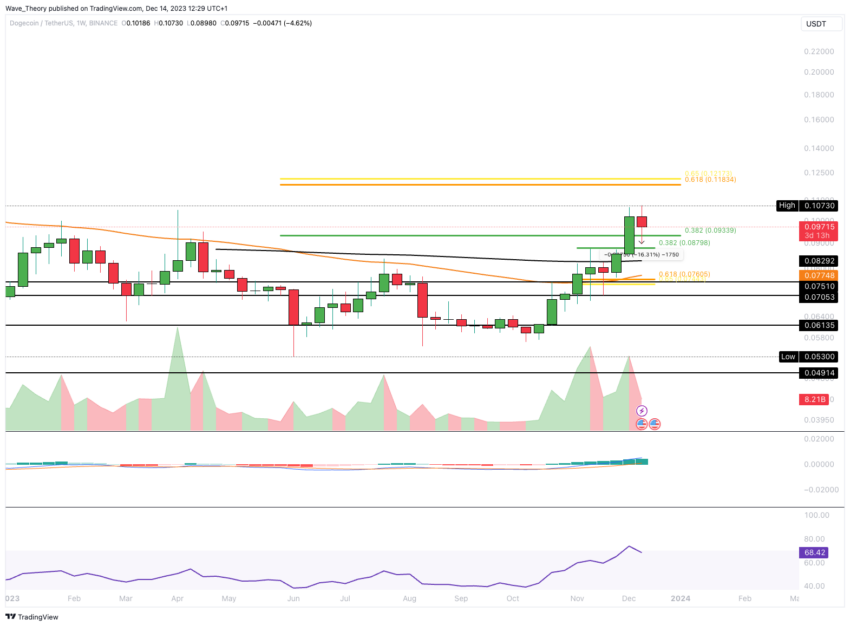
Should Dogecoin’s corrective trend continue, the next significant Fibonacci (Fib) support levels are anticipated to be around $0.088 and $0.076. Additionally, the 200-week and 50-week EMAs provide further support levels at approximately $0.082 and $0.0775, respectively.
These EMA levels could act as critical points for potential rebounds or further corrections.
Daily Chart Analysis: Dogecoin Shows Mixed Indicator Signals
In the daily chart for DOGE, the Exponential Moving Averages (EMAs) display a golden crossover. This is a positive sign that indicates a bullish trend in the short to medium term. However, there are signals of potential bearish momentum as well: the Moving Average Convergence Divergence (MACD) lines are nearing a bearish crossover.
Additionally, the MACD histogram has been trending downwards in a bearish manner for several days. This suggests increasing bearish momentum or a potential slowdown in the bullish trend.
Meanwhile, the Relative Strength Index (RSI) is in a neutral zone. This does not provide strong indications toward either a bullish or bearish trend.
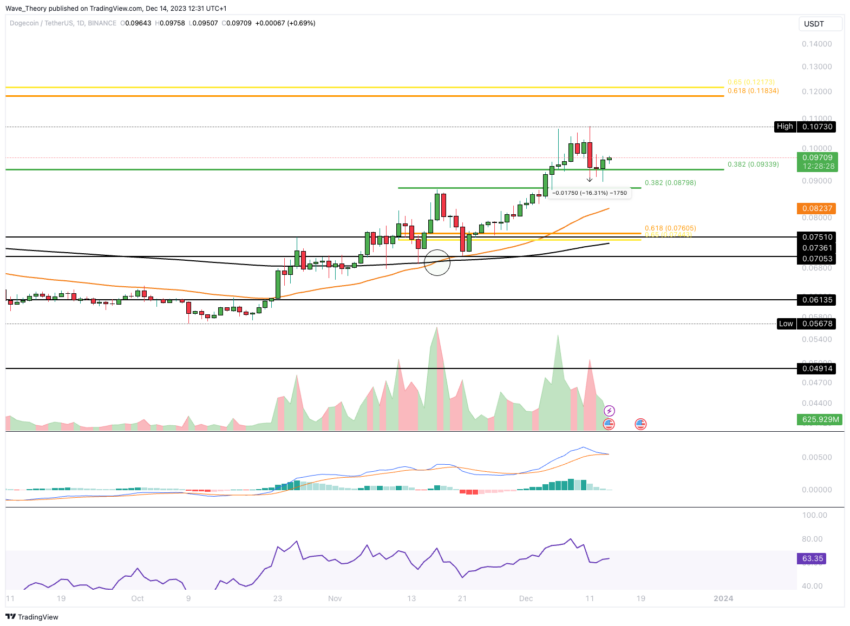
Despite these mixed signals, the current price of DOGE seems to be finding support at the 0.382 Fibonacci (Fib) level. This currently is around $0.088. This support level could be crucial in determining whether Dogecoin’s price will stabilize and potentially rebound or continue its downward correction.
Is Dogecoin Poised to Surpass Its Next Price Milestone?
If DOGE successfully breaks through the Golden Ratio resistance level at approximately $0.1, it could signal an end to the current corrective phase and set a new target at the Golden Ratio level of around $0.12.
Supporting this bullish potential, the 4-hour (4H) chart shows that the Moving Average Convergence Divergence (MACD) histogram is trending upwards bullishly, and the MACD lines have also crossed in a bullish direction.
Additionally, the Relative Strength Index (RSI) is currently neutral, not indicating any strong bearish or bullish momentum.
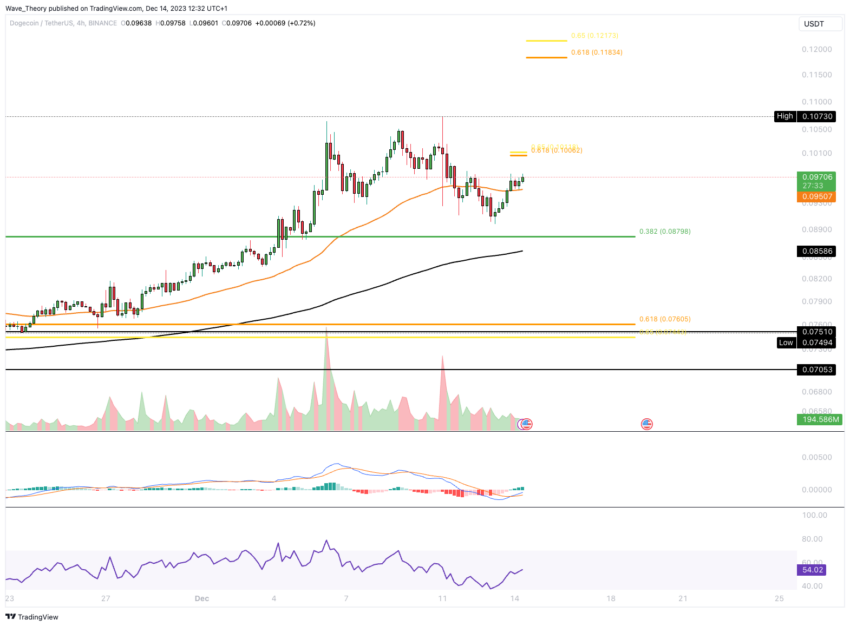
The Exponential Moving Averages (EMAs) in the 4H chart exhibit a golden crossover. Which further confirms the short-term bullish trend for Dogecoin. This combination of bullish MACD indicators and a golden crossover in the EMAs, along with a neutral RSI, presents a favorable short-term outlook for DOGE, especially if it can overcome the critical resistance at $0.1.
DOGE Faces Bearish Rejection at 0.0000025 Golden Ratio Against BTC
In its trading against Bitcoin (BTC), DOGE faced a bearish rejection this week at the golden ratio resistance level, approximately 0.0000025 BTC. Following this rejection, the next significant Fibonacci (Fib) support levels for Dogecoin are now positioned at around 0.00000224 BTC and 0.0000021 BTC.
Despite this recent bearish rejection, the Moving Average Convergence Divergence (MACD) histogram has been showing a bullish trend since last month. This indicates increasing bullish momentum. However, the MACD lines are still in a bearish crossover, presenting a mixed signal. Additionally, the Relative Strength Index (RSI) is currently in a neutral zone, suggesting a balance between buying and selling pressures.
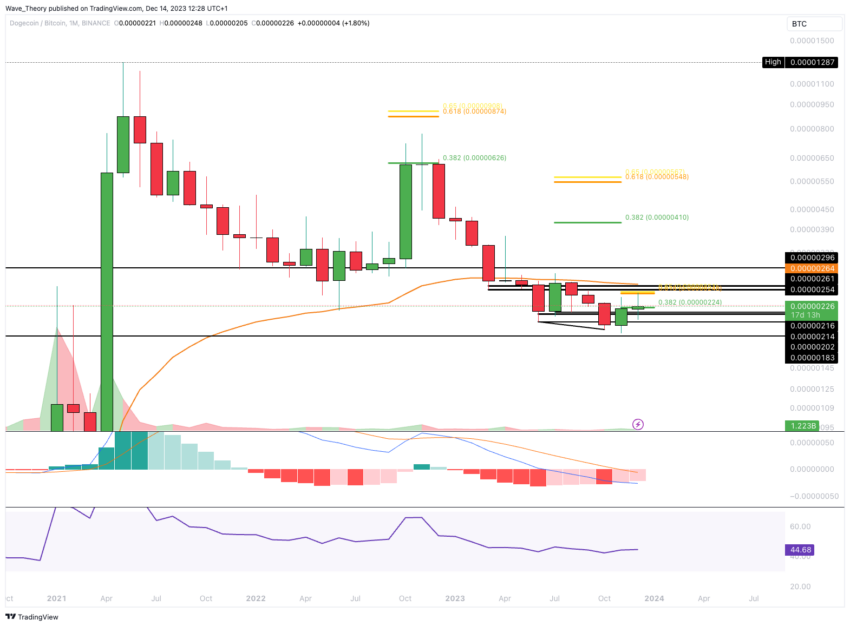
This combination of indicators – a bullish MACD histogram, bearishly crossed MACD lines, and a neutral RSI – suggests a complex and somewhat contradictory market scenario for Dogecoin in its pairing with Bitcoin, reflecting both bullish potential and bearish resistance.