2024 Q1 Public Chain Financial Report: How are the revenue performance of public chains?
Last week, the U.S. stock market ushered in the busiest earnings week in the first quarter, with nearly half of U.S. listed companies choosing to release their earnings this week. After experiencing a sharp drop last Friday, the markets attention is on the earnings data that the technology giants have or will release this week.
Amid the financial report fever, several public chain financial report data charts released by blockchain data analysis company Token Terminal on its official Twitter account two days ago also attracted the attention and discussion of the crypto community. After several sets of data, the financial status of L1 and L2 public chains such as ETH, Solana, and Base became much more intuitive. However, the first reaction of more people to public chain financial reports is: Is this concept really reasonable?
The term financial report has always been far away from the crypto industry. In this market where the business model is not yet clear and the teams monetization is still mainly based on token issuance, data such as the number of active addresses, TVL, and market value seem to be more intuitive and transparent. Is the traditional financial report logic applicable to the crypto market? Is the subject of measurement the protocol or the team? What statistical indicators should be used? These questions make the chain business seem out of place when compared with traditional business. They shout Mass Adoption all day long, but they know the Ponzi game in their hearts. This is probably the general view and cognition of crypto people on the industry.
So is the concept of financial reporting applicable to the crypto industry? I prefer a positive answer. Although there may be many differences in specific indicators and presentation logic, public chains (especially general-purpose public chains such as Ethereum and Solana) as decentralized networks essentially need the ability to generate their own blood, just like traditional companies, otherwise they will become real Ponzi.
So for a chain, how can it be called capable of generating profits?
The public chain that is burning money
In fact, in the current crypto industry, except for Bitcoin, a decentralized ledger, almost all public chains need to have the ability to generate revenue in order to survive safely and for a long time.
For BTC, its market value and price reflect the amount of wealth that the outside world has put into the Bitcoin ledger. In order to obtain the security of the Bitcoin network, these riches are willing to pay the miners a satisfactory property custody fee. But this does not seem to work for general-purpose public chains such as Ethereum and Solana. Because miners are a profit-seeking group, they go wherever they can make more money, and the world computer that general-purpose public chains have to maintain is not very attractive to the wealth of the outside world. Therefore, from the perspective of supply and demand, the burden of paying the cost of hiring miners (of course, most of them are validators now) to look after the house is generally on the shoulders of the network itself.
In simple terms, general-purpose public chains need to find ways to generate revenue to pay validators who maintain the network. This is not just a simple token issuance incentive, but also a long-term value support for the issued tokens. This is the basic hematopoietic ability of the public chain. Of course, hematopoiesis is not all for survival. In the stock market, stronger revenue capabilities mean stronger repurchase strength and stock price expectations, and the same is true for public chain businesses.
According to this logic, it is clear at a glance what data should be included in a public chain financial report.
The first is naturally operating income. For a public chain, this part comes entirely from network fees, and the part of the fees that is destroyed can be regarded as the networks revenue (equivalent to repurchase). The more network activities there are, the higher the fee income. The second is operating costs, including the part of each network fee paid to the validator (supply fee; Supply-Side Fees), and the token incentives issued by the network. The fewer tokens issued, the lower the cost. Finally, there is gross profit, which is the token destruction minus the token issuance (and validator fees). This is the ultimate manifestation of a public chains hematopoietic ability and network value. It is not difficult to see that for a public chain, the amount of Gas destruction and block incentive issuance largely determines its revenue capacity and self-sustainability.
So how did the general-purpose public chains perform in the first quarter of this year? We selected three representative cases for comparative analysis, namely Ethereum, which uses gas buyback and destruction based on the base fees of the block, Solana, which uses 50% of the fees for buyback and destruction, and Avalanche, which destroys 100% of the fees.
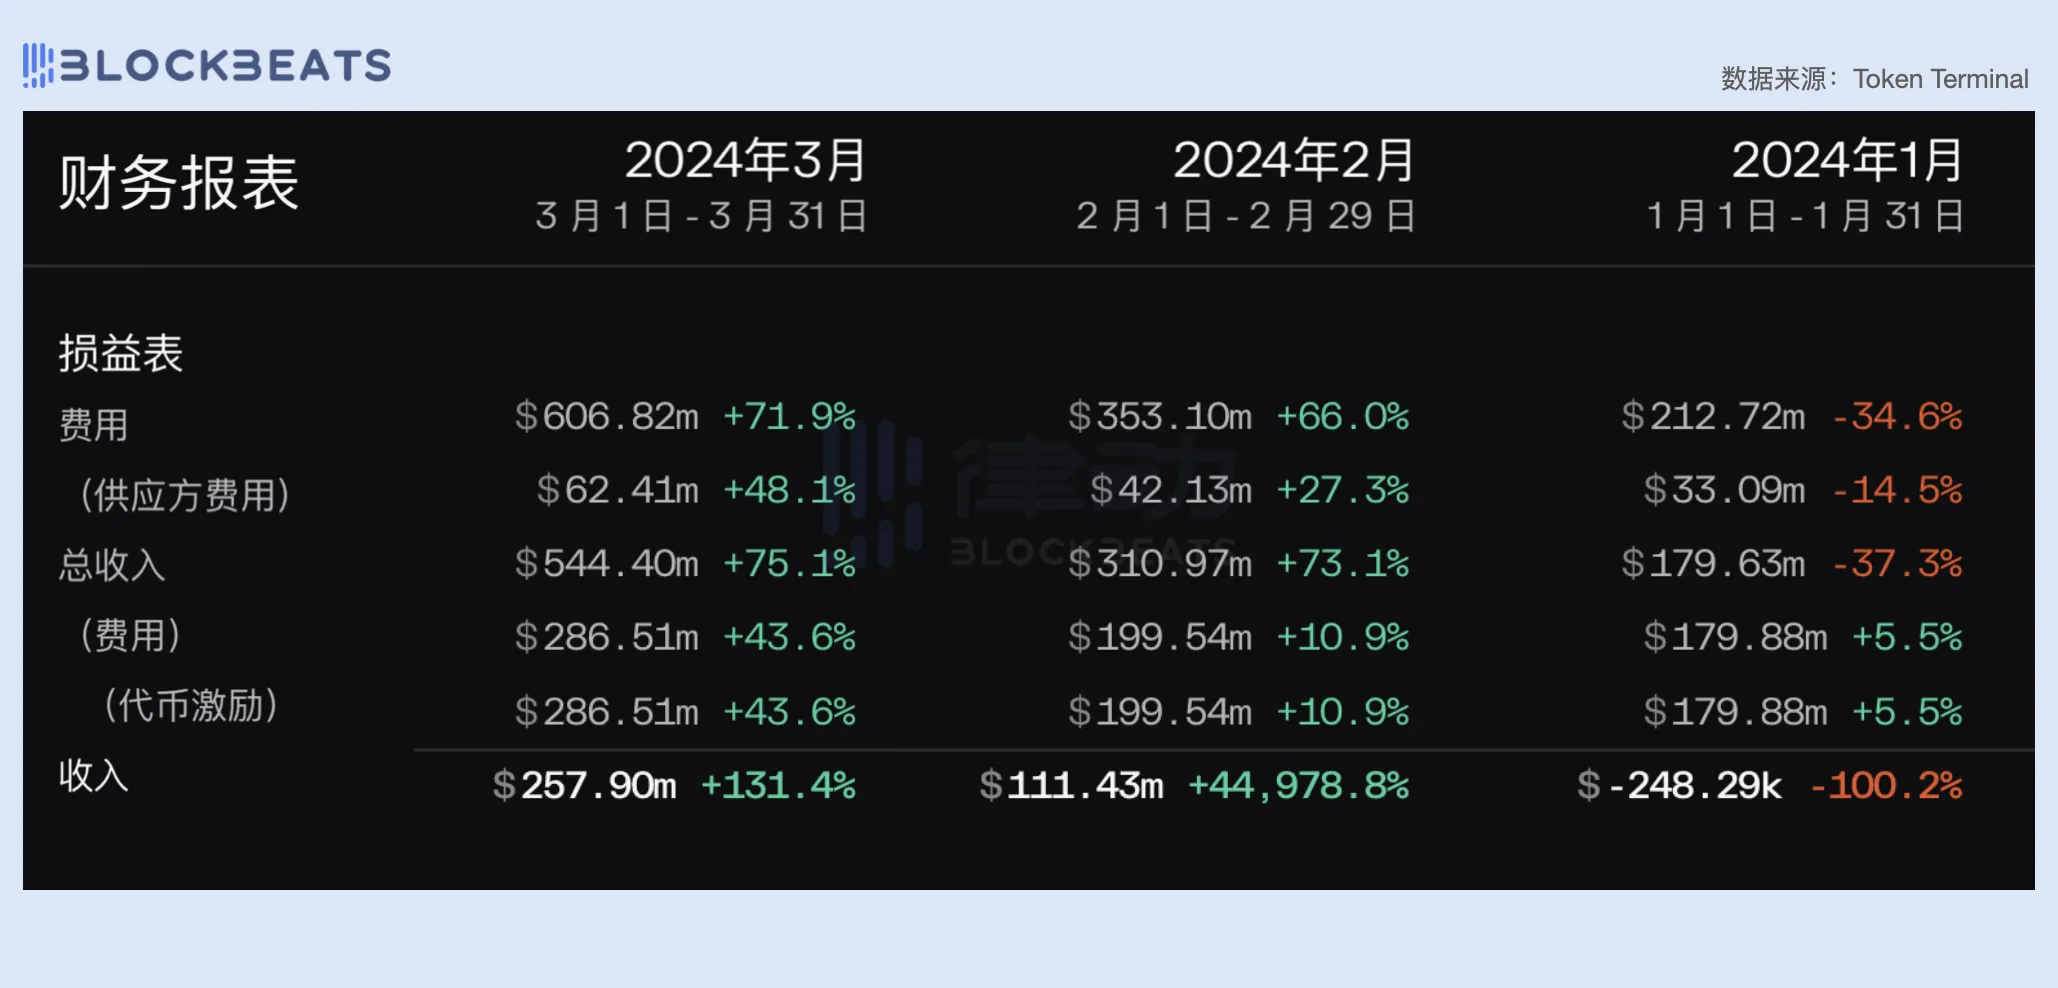
Judging from the final quarterly report, Ethereum is still the most profitable general-purpose public chain in the current crypto world, with revenue of $1.17 billion and net profit of $369 million in the first quarter of 2024. Although Solana has a strong ecological momentum in the past six months, due to the advocacy of ultra-low Gas concept and the lack of a dynamic fee mechanism, it only achieved less than $100 million in revenue in the first quarter, while its network operating costs (i.e. token incentives) were as high as $844 million, with a total loss of $796 million. The Avalanche network had almost no revenue in the first quarter, and lost $179 million after deducting costs.

ETH: Barely breaking even
In detail, the Ethereum network turned a profit in February this year, and its revenue continued to grow throughout the first quarter, with revenue of $606 million in March, accounting for 51.7% of the first quarters revenue. In March, Bitcoin prices hit a record high, and the crypto market sentiment was high. Thanks to the surge in the number of on-chain transactions, the average gas per transaction and total fee income of the Ethereum network have increased significantly.
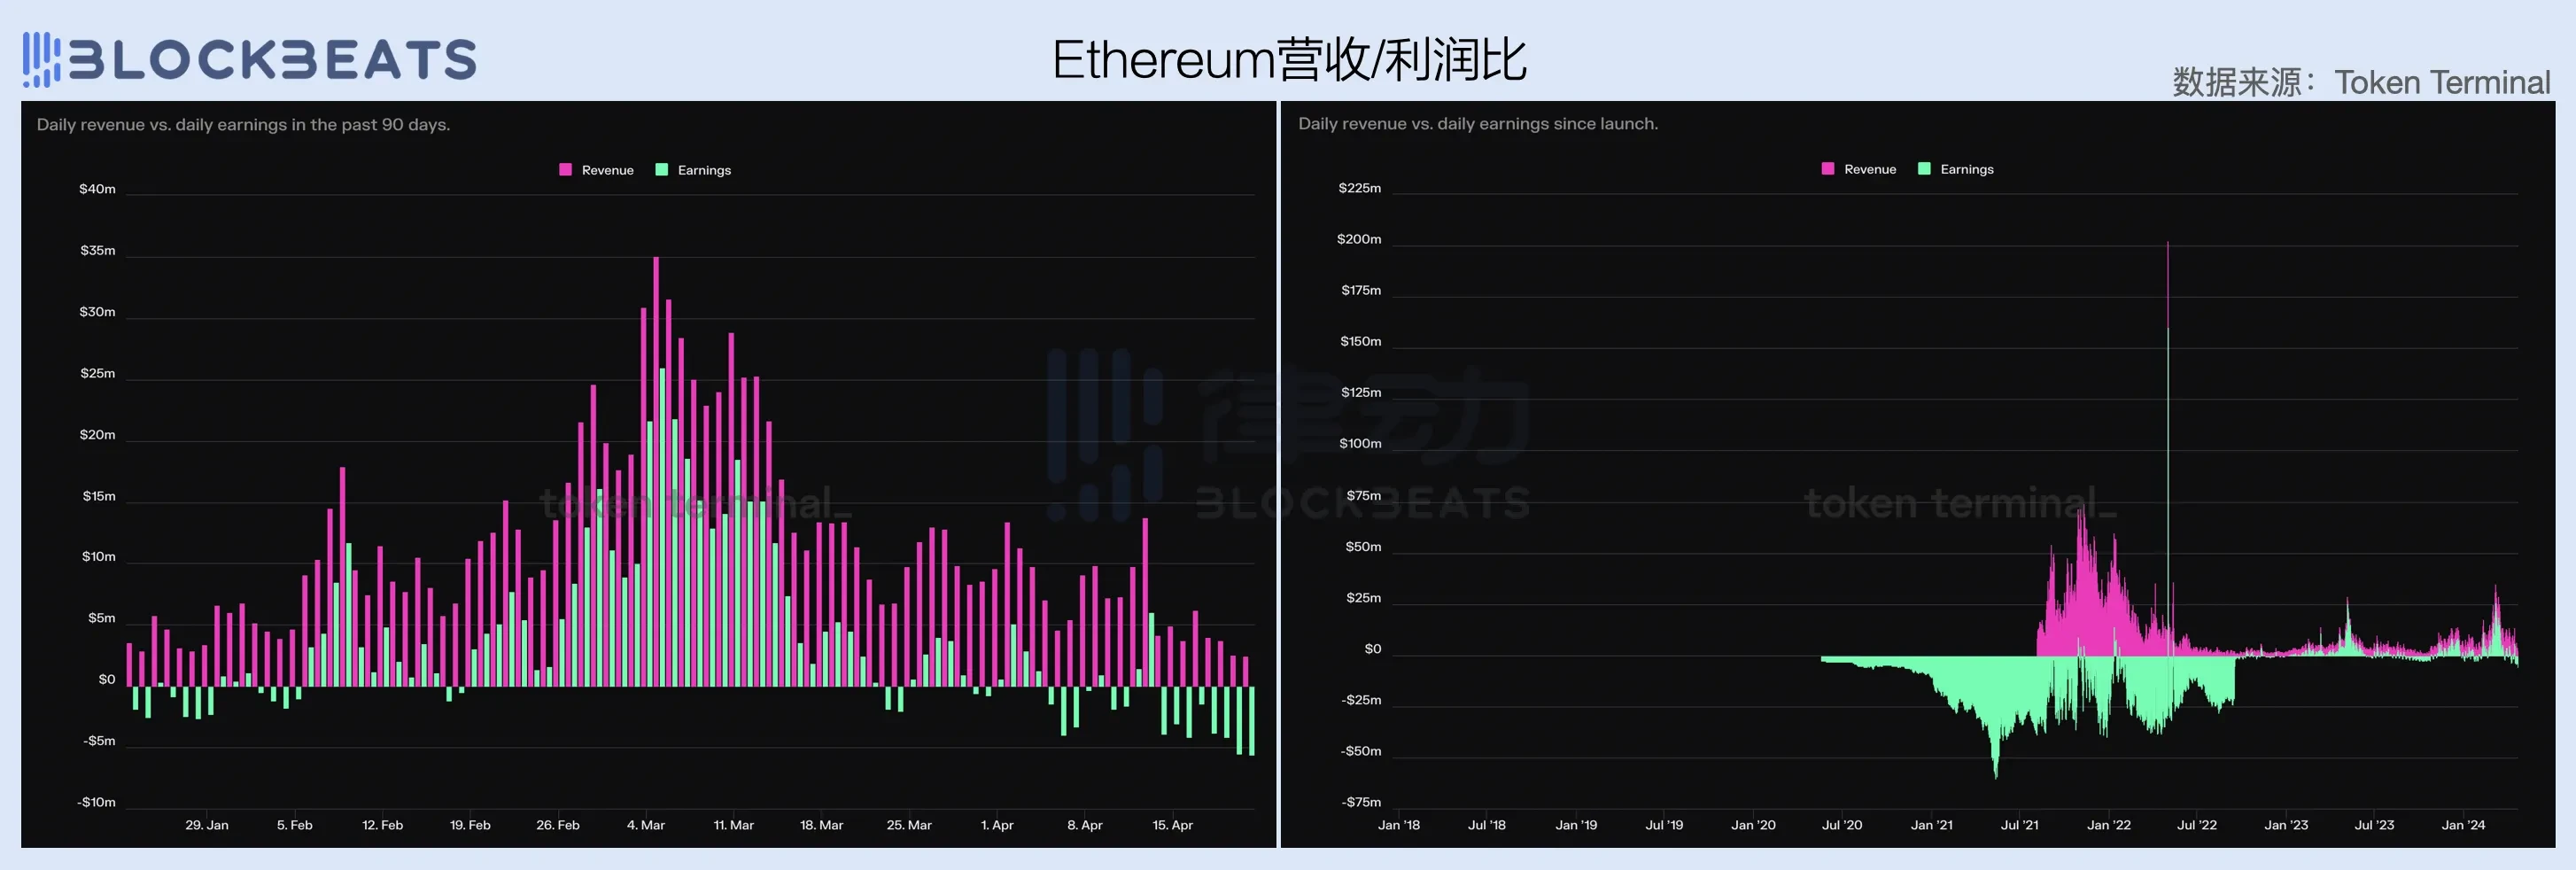
Judging from the data comparison of network revenue and operating costs, the operating costs of the Ethereum network are relatively stable. Since the completion of the merger in September 2022, it has remained at around US$4 million per day for a long time. However, with the increase in ETH prices and block space demand, this figure began to climb from mid-to-late February and currently remains at around US$8 million per day.

In terms of revenue, Ethereum has introduced a Gas buyback and destruction mechanism since the launch of EIP-1559 in August 2021, and has truly begun to generate network revenue. EIP-1559 stipulates that the base fee (Base Fee) required for each transaction will be completely destroyed, so the networks revenue is positively linearly related to the on-chain transaction volume and the degree of block space demand. The more on-chain transactions and the greater the block space demand, the higher the average base fee for destruction.
However, it is worth noting that when we extend the observation range to the last bull market, the current revenue capacity of the Ethereum network has actually decreased, which is also strongly related to the market cycle. In contrast, the average daily revenue of the Ethereum network during the peak period at the end of 2021 was about 3 times the current level.
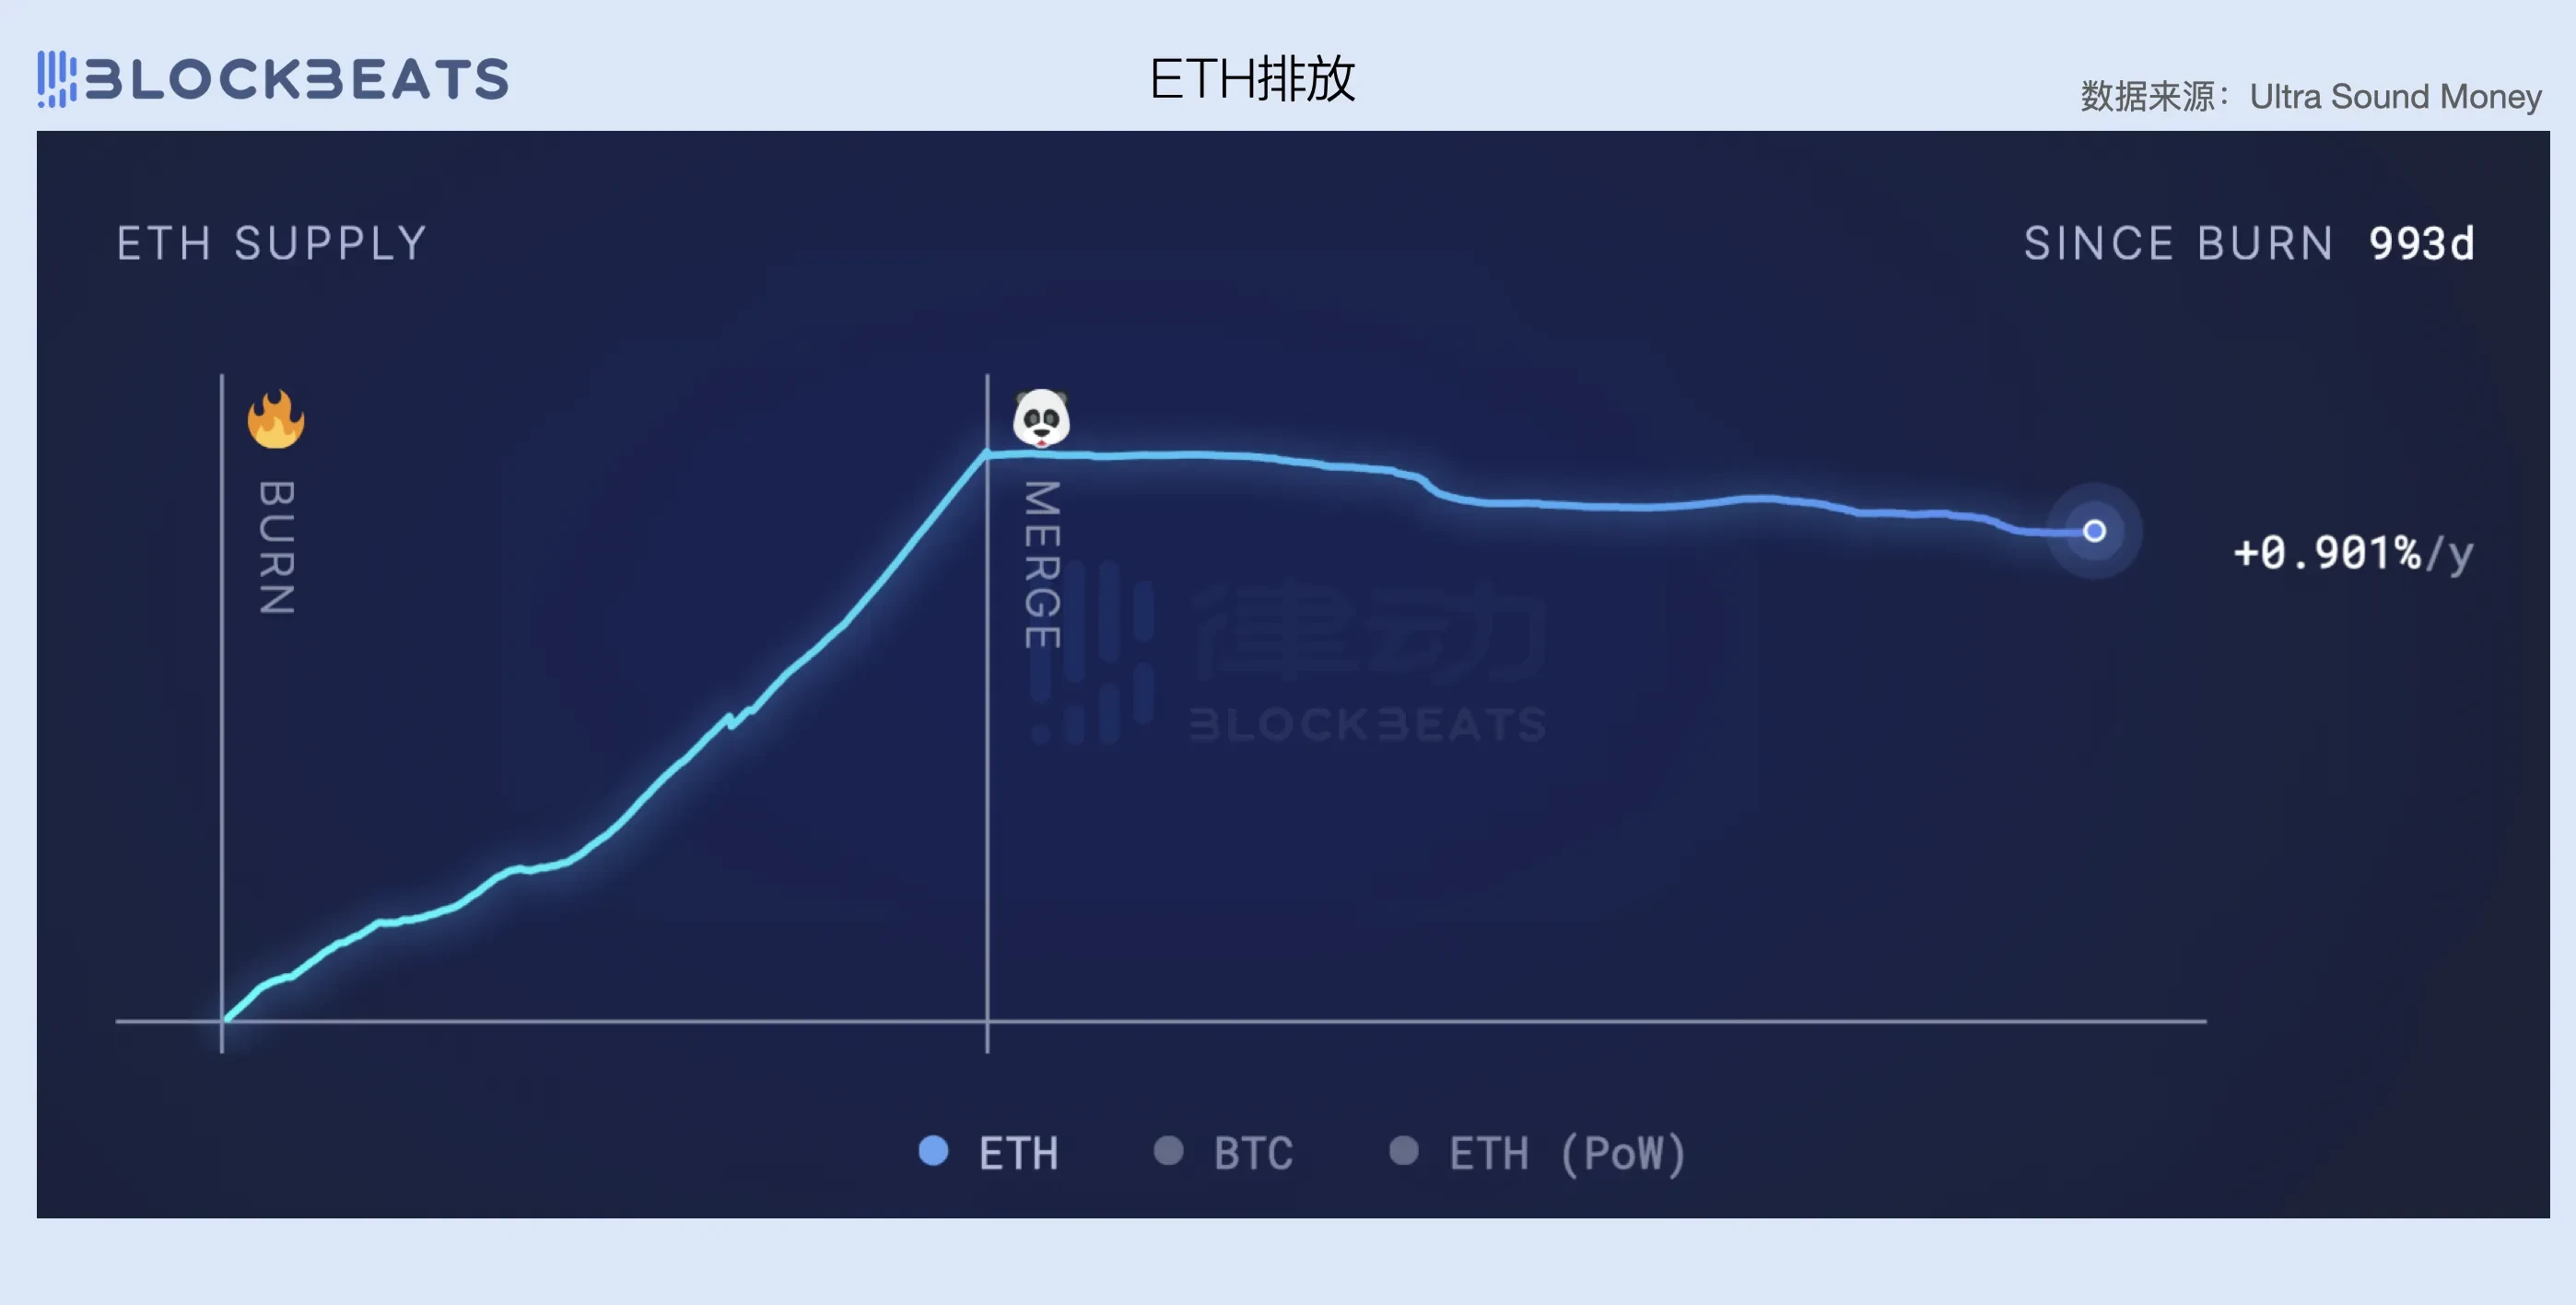
Another point that can be observed is that the transition to PoS has indeed become a key factor in Ethereums balance of payments. Before switching from PoW to PoS, Ethereum still needed economically intensive labor such as graphics card mining machines to maintain its network, which also led to the network paying miners very high operating costs. According to the official website of Ethereum , before the merger, the Ethereum network had to pay miners 2 ETH in operating costs every 13.3 seconds (i.e. one block), plus ommer blocks (blocks not included in the longest chain), Ethereums daily operating costs were as high as about 13,000 ETH.
After switching to PoS, node validators no longer need high maintenance fees, and the network operating cost is only 1,700 ETH per day based on the total amount of staked ETH (about 14 million ETH), which directly saves about 88% of the network cost. Therefore, although Ethereums current revenue capacity has declined, compared with the sharp drop in costs, the network can still maintain a basic balance of income and expenditure.
From the data comparison of network revenue and net profit, the gross profit margin of the Ethereum network after the merger is roughly maintained in the range of 40% to 70%. The more congested the network is, the higher the gross profit margin is. In addition, the entire network currently needs to maintain a daily revenue of US$8 million to achieve profitability. For example, although it is not within the scope of the first quarter, it can be seen from the figure below that due to the impact of market conditions, Ethereums fee income has been declining throughout April. Therefore, after achieving profitability for two consecutive months, the Ethereum network has entered a loss-making state again. It can be seen how difficult it is to make a chain self-sufficient.
Further observation of the comparison between the number of daily active addresses and contract deployers (eco-developer data proxy) on the Ethereum network can provide us with some additional perspectives. In the first quarter, the number of daily active addresses on the Ethereum network remained at around 420,000, but the number of contract deployers declined significantly, from an average of 4,000 per day in January to an average of 2,000 per day in March.
In the long run, the number of developers in the Ethereum network ecosystem seems to have stagnated since the end of the last bull market, and even began to shrink rapidly after February 2024. As the market enters a new round of upward cycle, the Ethereum network is trapped in a dilemma of developer exodus and slowing growth of active users, which is closely related to the lack of innovation in application scenarios within the ecosystem.

During the bull market from 2020 to 2022, exciting native crypto innovations such as DeFi, NFT, GameFi, SolcialFi, etc. were all born from the Ethereum ecosystem, and each narrative had a profound impact on the future development of the industry. In 2024, people once again expect Ethereum to reappear and bring everyone a bright narrative innovation, but at present, apart from the re-staking of Eigen Layer, there is almost no new stuff in the ecosystem that makes people excited.
On the other hand, this is also because there is a mismatch between market expectations and the laws of industry development. The innovative development of an industry and the capital effect it brings are often causal. Similarly, just because the crypto market cycle is every 4 years, we cannot force the industry to innovate at the same pace. Of course, there are indeed industries such as AI and nuclear energy that rely on capital leverage to achieve technological progress, but blockchain and Web3 are obviously not in this category.
More importantly, the crypto market in the past few months has been almost entirely driven by Bitcoin ETF funds. The macro environment has not brought significant liquidity injection to the market, and the altcoin field is more of a game between existing funds. In this context, Solanas meme craze and the brewing Base Season narrative are undoubtedly sucking blood from the Ethereum ecosystem.
Without playing the two cards of low gas and mass consumption, how to create a higher demand for blocks sold on the Ethereum network is a core issue that the foundation and top VCs need to think about.
Solana: Burning money like crazy to drive revenue
Compared with Ethereum, which has basically achieved a break-even, Solana is still in a clear money-burning stage, with an overall loss of $797 million in the first quarter, of which $380 million, or 47.6%, was lost in the third quarter. As the price of SOL rises, the operating costs of the Solana network have continued to rise in the past quarter, from $212 million in January to $414 million in March, nearly doubling.
However, it is worth noting that despite the sharp increase in costs, Solanas revenue in the first quarter grew rapidly, with network fees (including supply-side fees) of $69 million in March, nearly five times the $15.38 million in January. This was due to the continuous meme craze in the Solana ecosystem in March and the surge in transaction volume and priority fees brought by ORE mining, but it is still a drop in the bucket compared to the cost expenditure of the entire network.

From the data comparison of network revenue and operating costs, the expenditure-to-income ratio of the Solana network in the first quarter remained at 15 to 30 times, which means that the network needs to spend 15 to 30 US dollars for every US dollar earned, and the customer acquisition cost is extremely high. But if we look at it from a longer perspective, it will be found that for the Solana network, achieving this data is already a huge improvement. In the past year and the last bull market, Solanas network revenue was almost negligible. In March, the Solana networks daily revenue reached 1 million US dollars, which is a significant increase compared to the daily revenue of 145,000 US dollars during the peak of the bull market in 2022.

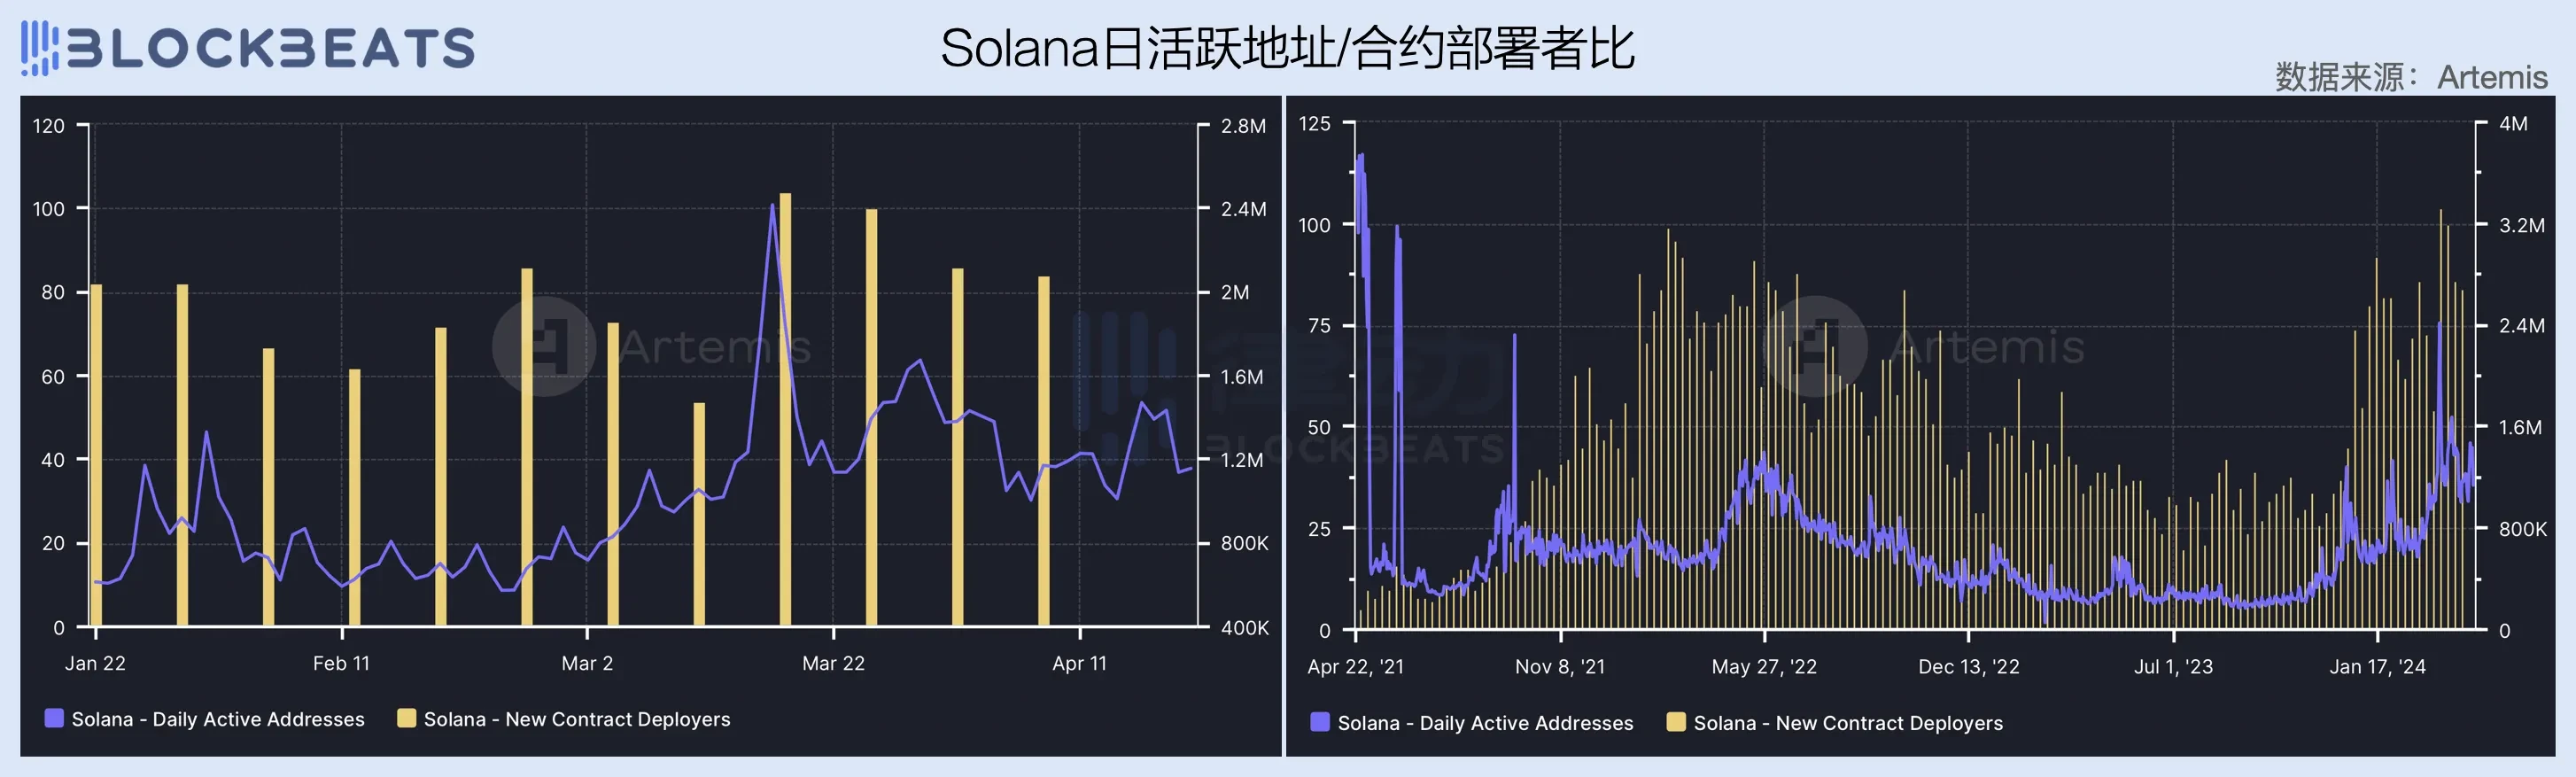
The increase in revenue capacity is inseparable from the growth of network users. In the past quarter, the daily active addresses of the Solana network continued to rise, and in mid-March, when meme gods such as BOME and SLERF burst out one after another, it set a historical record of 2.4 million. The number of network contract deployers has also shown an upward trend since the end of last year, and has remained at an average of 80 people per day throughout the first quarter.
Compared with Ethereum, Solana has cultivated strong stickiness among developers in the ecosystem because it has insisted on the non-EVM compatible route in the past, effectively reducing the situation of developer exodus. In addition, a series of wealth-making waves since the JTO airdrop have also attracted a large number of external users and developers to the network. However, it should be noted that since the current high growth of Solana network users is mainly driven by burning money subsidies, there is also a lack of effective innovation in application scenarios in the ecosystem. Once the capital subsidy is released, this growth potential can easily fade quickly.
On the other hand, although 50% of the transaction fees of the Solana network are used for repurchase and destruction, the surge in the number of transactions has not brought significant revenue, which also indirectly reflects that there are certain problems with the current fee mechanism of the Solana network.
Similar to Ethereum, Solana鈥檚 fee mechanism is also divided into base fees and priority fees. However, unlike Ethereum鈥檚 dynamic base fee mechanism, Solana鈥檚 base fees are statically measured in Lamports (generally 0.000005 SOL), while priority fees are measured in Compute Units required for each transaction.
As can be seen in the figure below, the proportion of priority fees has been rising since the beginning of the year, and most of the fee income of the Solana network comes from priority fees. According to The Block, of Solanas record -high fee income of $15.6 million in January, $11.9 million came from priority fees, accounting for 92% of non-voting transaction fees.
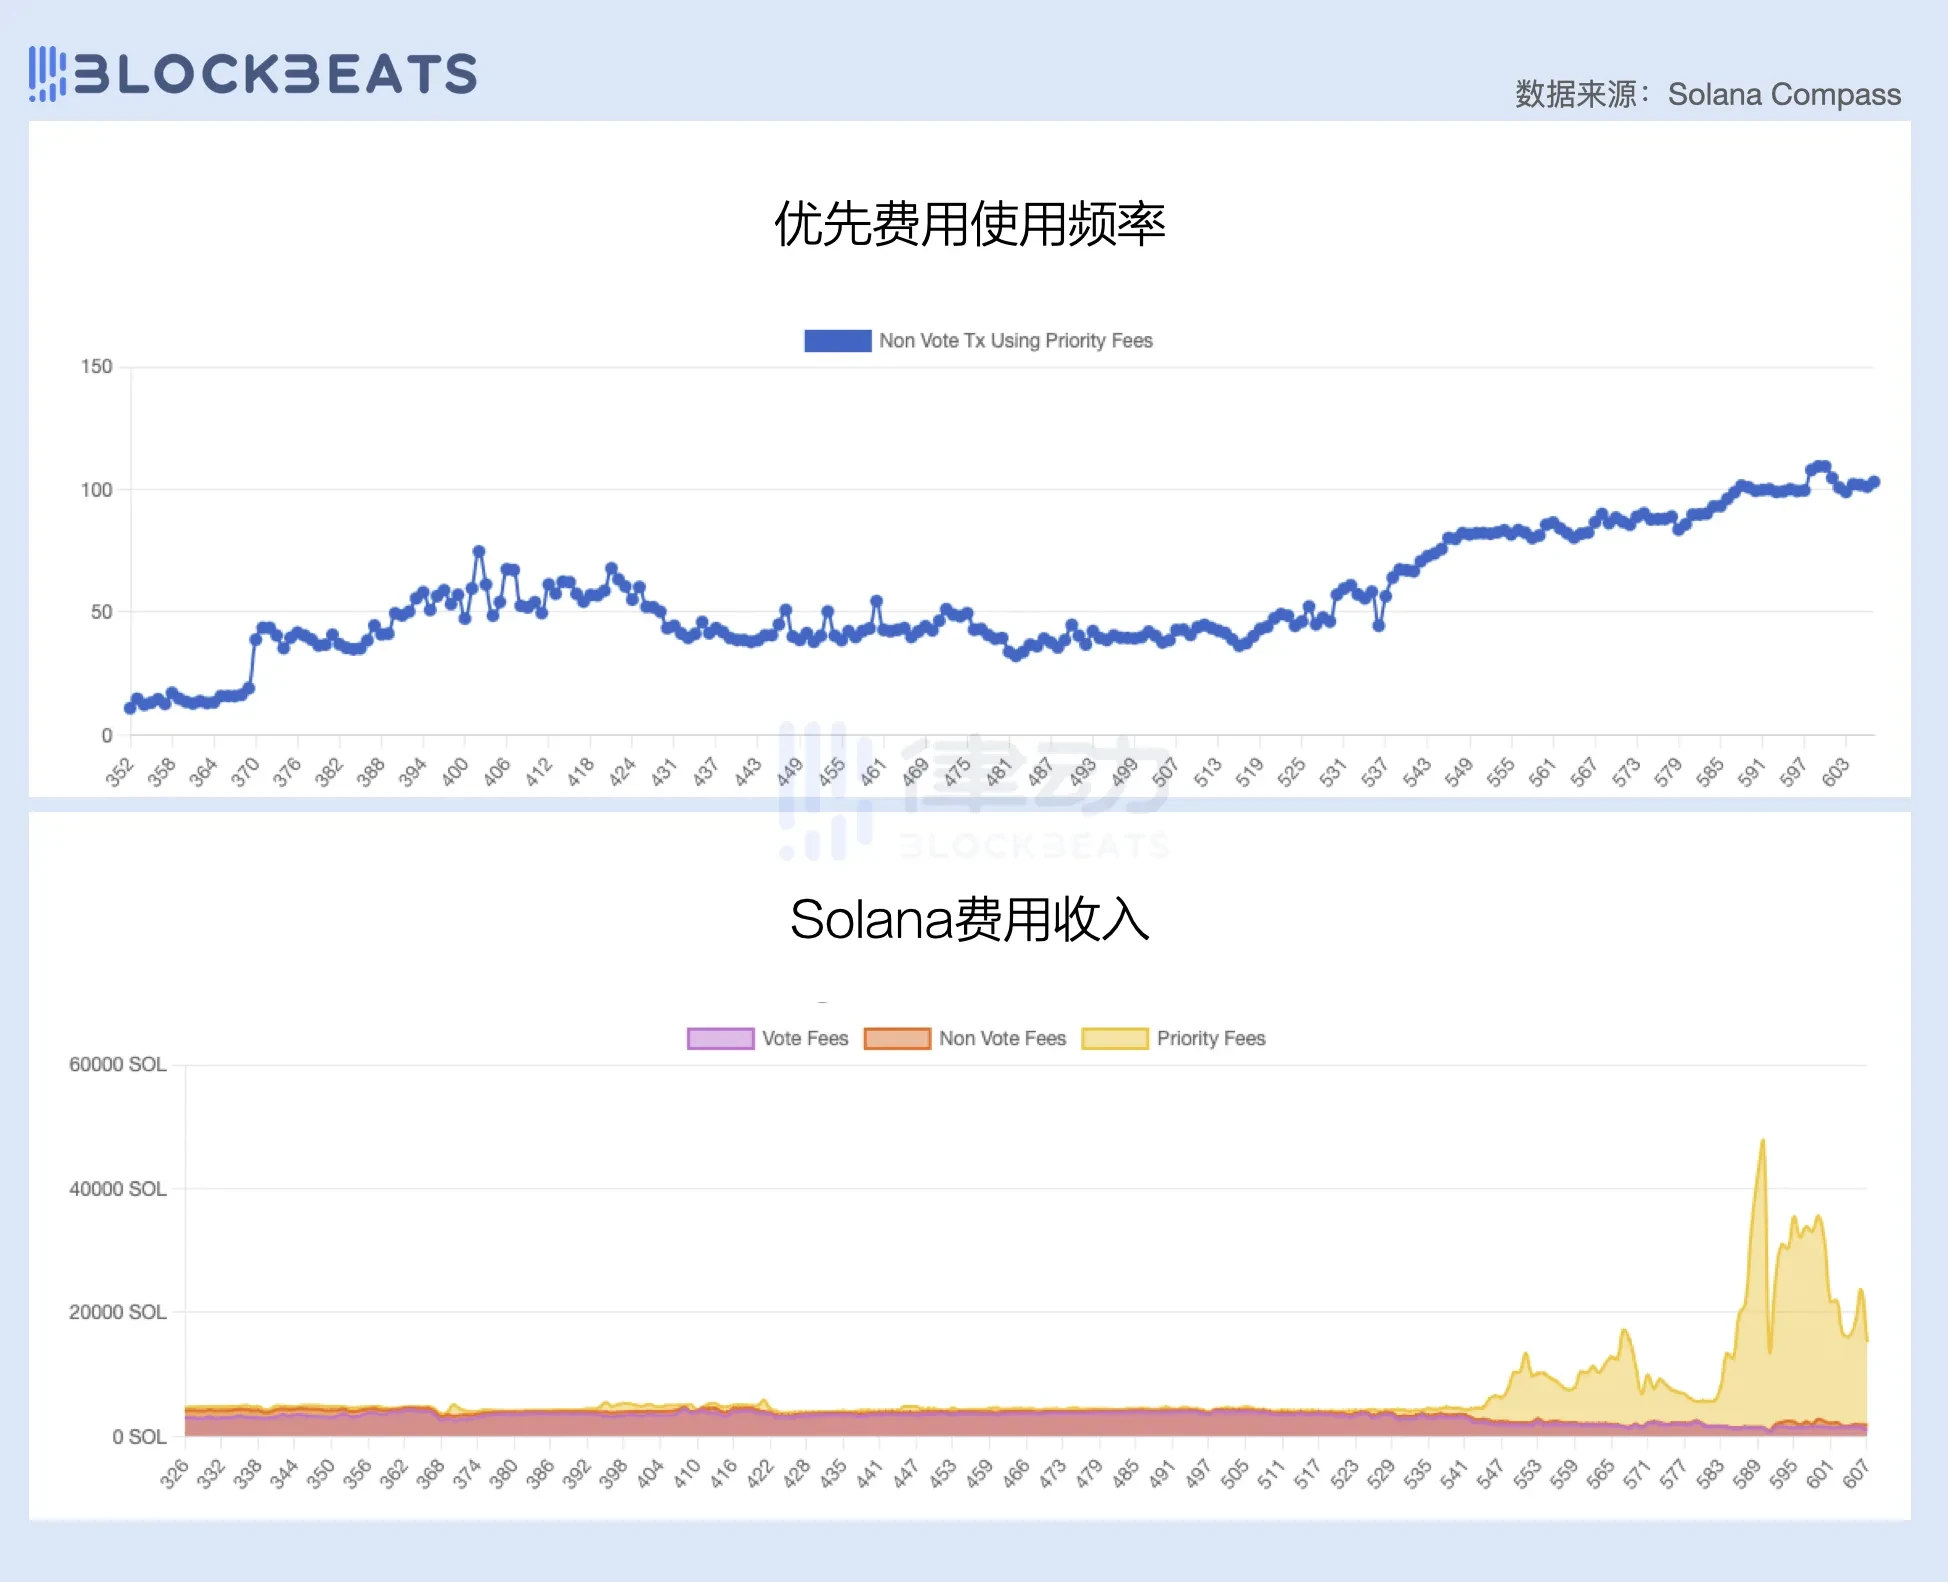
However, as many people have experienced from the poor experience of the Solana network over the past month, the current priority fee mechanism does not seem to solve the problem of pricing a specific block space very well. Although setting a priority fee can increase the chances of a transaction being included in a block, due to the nature of Solanas continuous block production, setting a higher priority fee does not guarantee that the transaction will be included in the block earlier.
The lack of a dynamic fee mechanism for accurately pricing block space has led many robots to resort to sending spams to get their transactions included in blocks, because in most cases, the basic fee cost of 0.000005 SOL will not exceed the expected profit after the transaction is successful. According to a research report by Umbra Research, due to the extremely high requirements for Searcher speed, arbitrage transactions with priority fees exceeding 0.02 SOL are rarely seen on the Solana network, and currently about 96% of arbitrage attempts on the Solana network will fail.
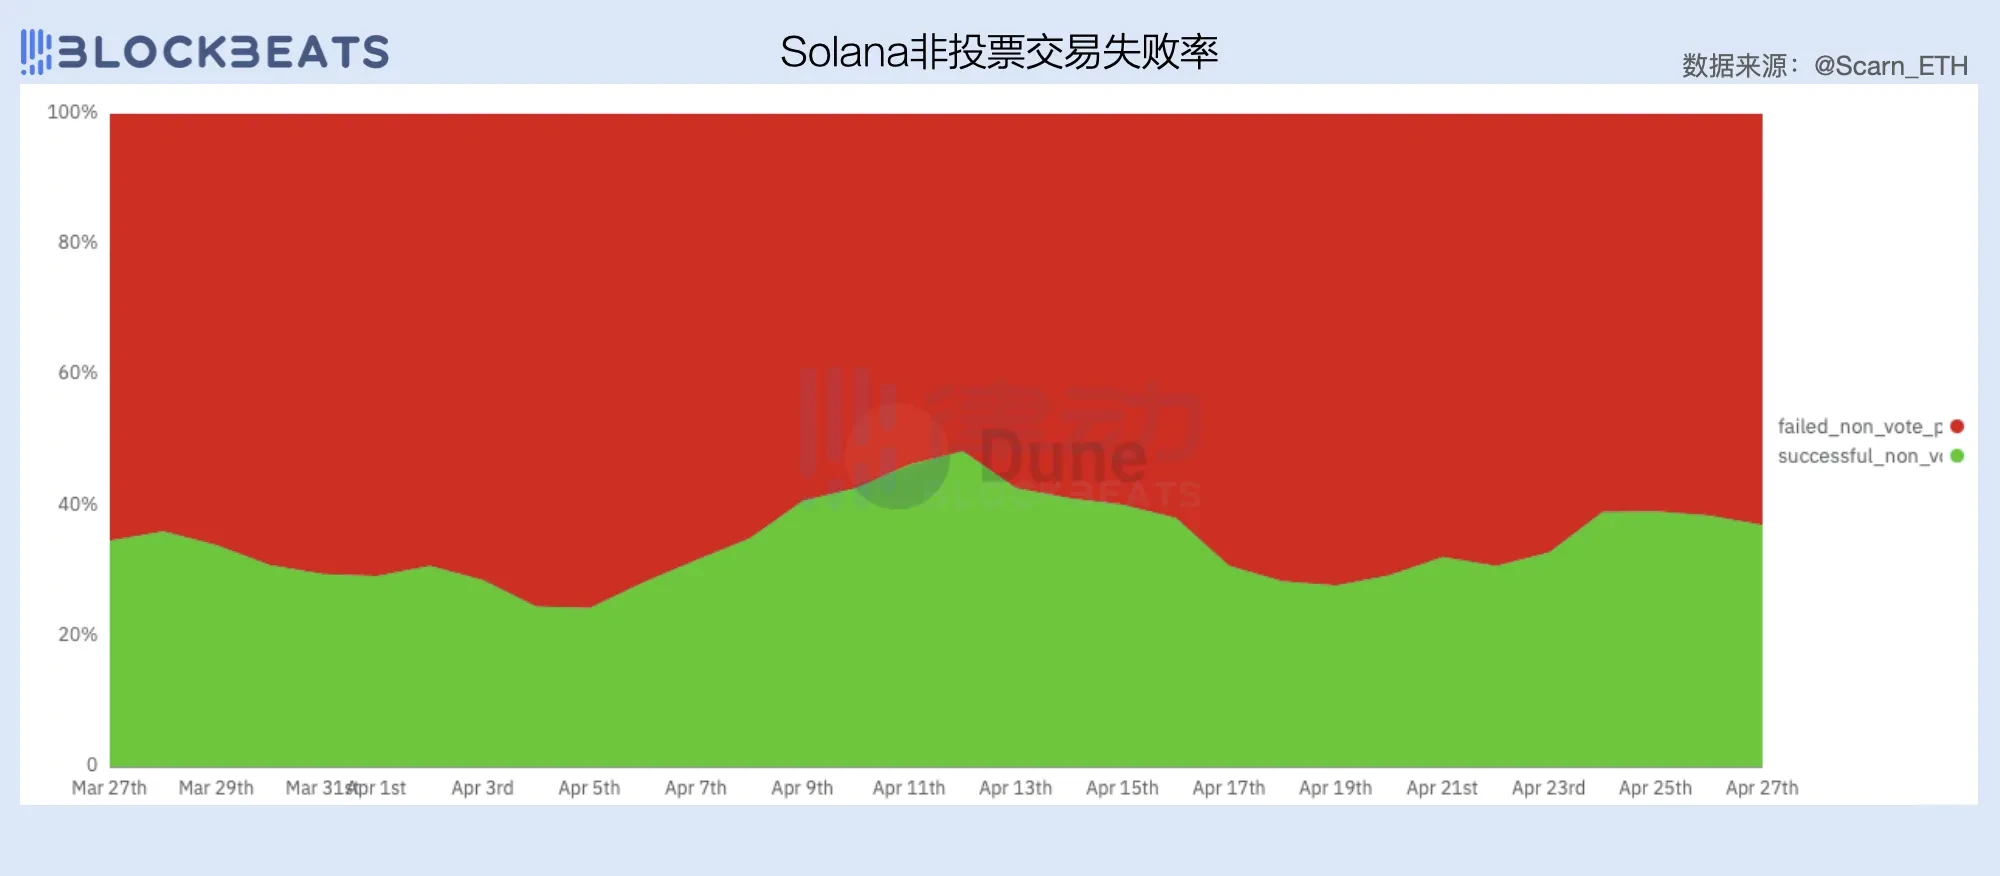
A large number of failed transactions seriously consumed block space, which not only affected the value capture efficiency of the validators for the blocks they were responsible for producing, but also caused a large number of users and transaction volumes to be lost. After Jitos MEV memory pool was closed in early March, Solana urgently needed to find a fee solution to effectively price block space and increase network fee income.
In addition to the growth difficulties on the revenue side, Solana needs to work harder on cost control if it wants to achieve a balance between income and expenditure.
In order to achieve ultra-high performance, the validator and node operating costs of the Solana network are significantly higher than those of Ethereum. The joke that running Solana nodes will crash the companys network is still a stereotype of many people about the Solana network.
According to Validators.app, 14% of Solana validators use Latitude as their hardware equipment, with bare metal products starting at $350 per month and C 3 Large monthly fees ranging from $370 to $470. In addition, many validators will choose to use dedicated bare metal servers directly, and the Solana Foundation has also reached long-term agreements with many data centers to ensure rack availability and monthly contracts.
Currently, the Solana network has more than 1,000 validators in operation, but the income gap between them is huge. Large validators like Jito can earn millions of dollars in profits from delegated staking, while many validators are in a loss. In addition to the custody costs (which can reach tens of thousands of dollars per year), Solana validators must also pay for voting qualifications (Voting Fees). According to Helius statistics , the fixed cost of each Epoch is about 3 SOL.
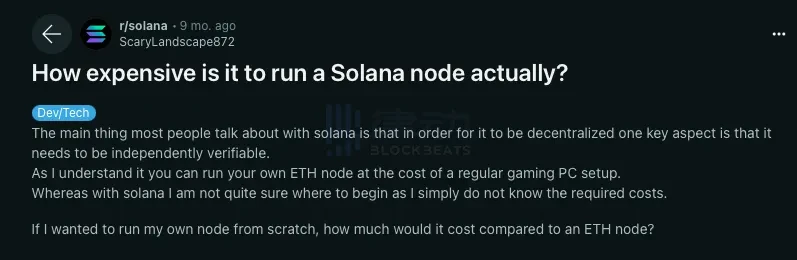
Many people have found that in order to make a profit, they need to have at least 5,000 SOLs of basic funds, and they must also have their own entrusted staking income. Of course, this indirectly increases the marketing expenses of validators. And this does not include the cost of running the Solana node. Due to the extremely high requirements for bandwidth and Uptime, many members of the Reddit community said that the Solana node can only run in a data center.
In order to maintain a high-performance network, the cost that Solana pays to super nodes must be high. According to Solanas inflation plan, the networks initial annual inflation rate is 8%, and it will decrease at a rate of 15% per year, eventually maintaining the annual inflation index at 1.5%.
On the bright side, Solana is designed to follow Moores Law and promises to double the networks scalability every two years by relying on the development of CPU and other technologies, which means carrying more users and generating higher fee income. On the negative side, it will take about 10 years for Solana to reach its target inflation level, and before that, the network is likely to remain in a loss-making state.
Although using low gas to beat Ethereum does work, it is like a price cut for new energy vehicles. No matter how fierce the price war is, you still have to find a way to make a profit. Low fees mean that Solanas selling point is no longer the block premium, and volume becomes the key to survival. What investors need to consider is how long their money can last?
Avalanche: Gradually losing hematopoietic ability
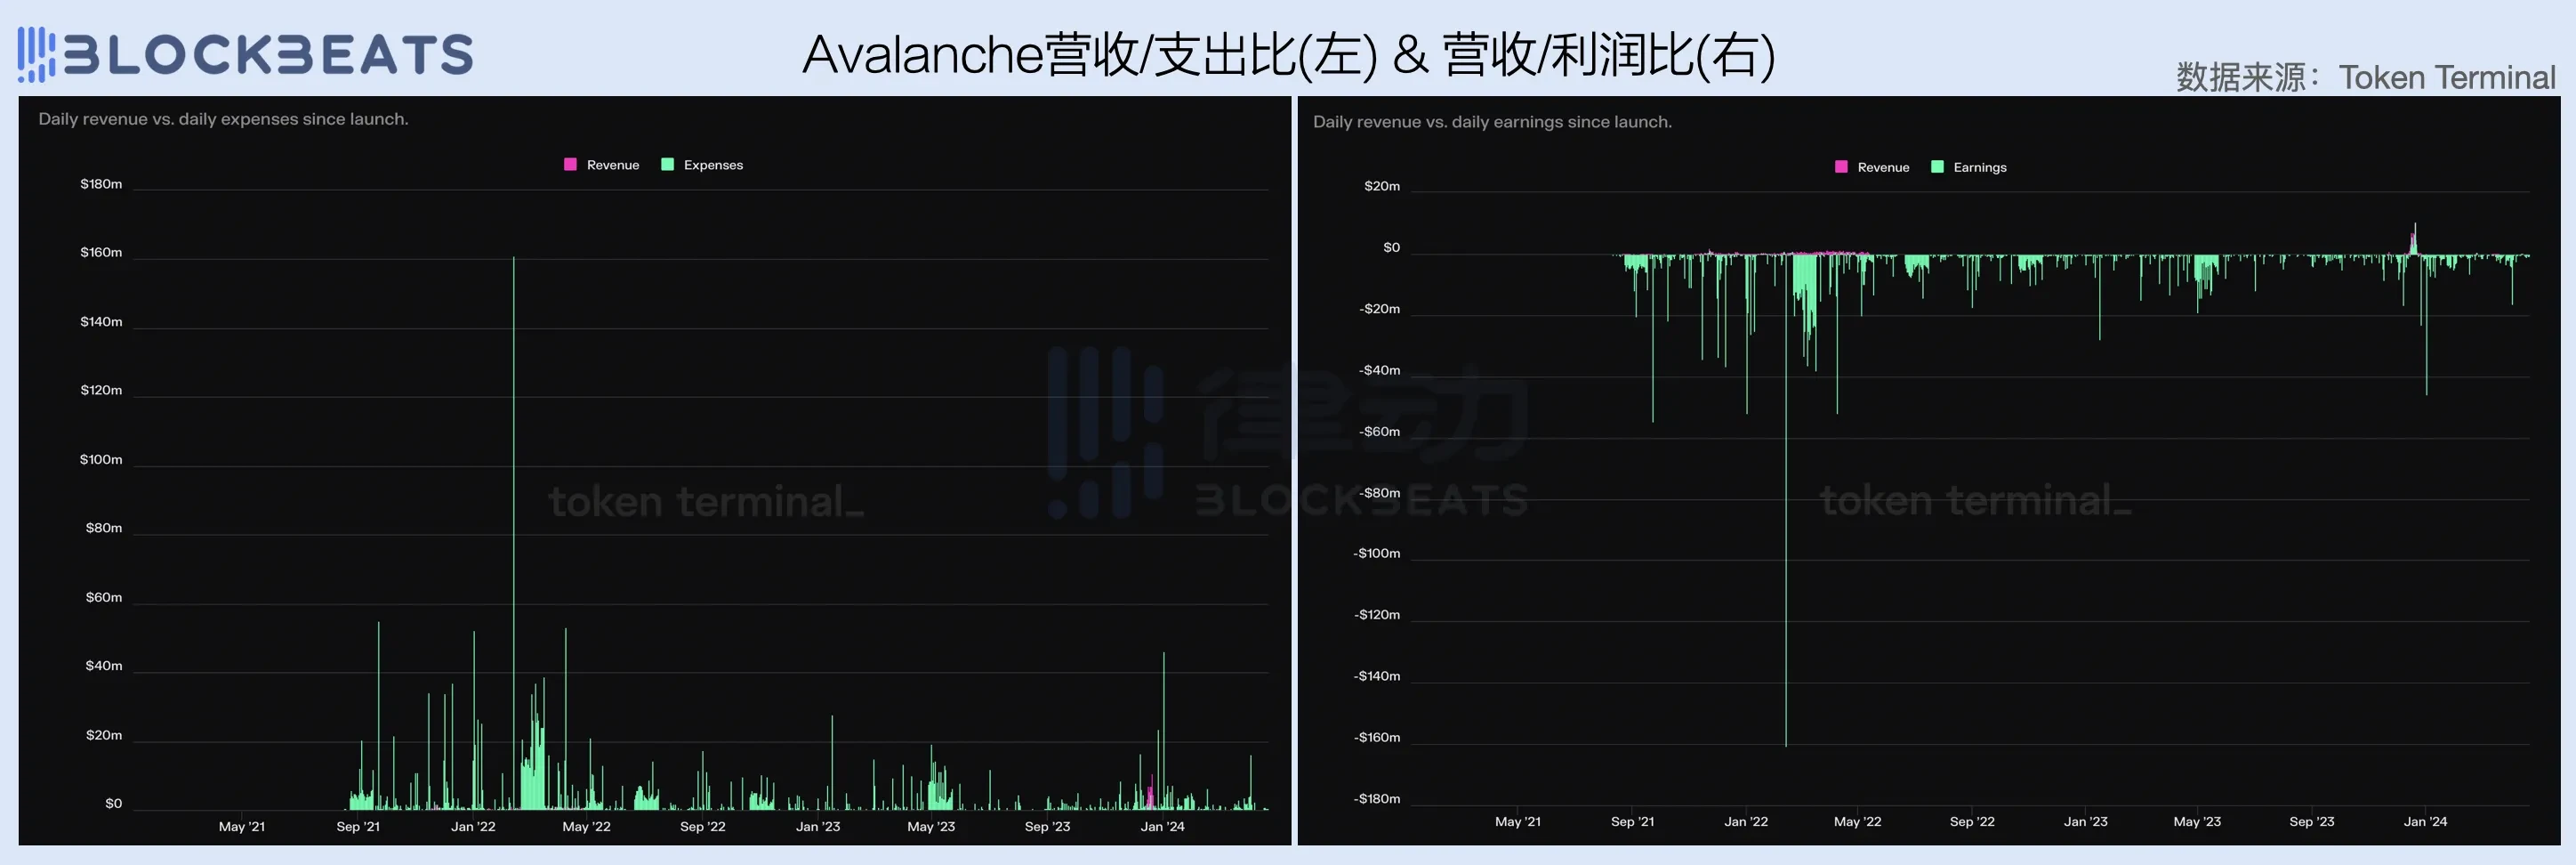
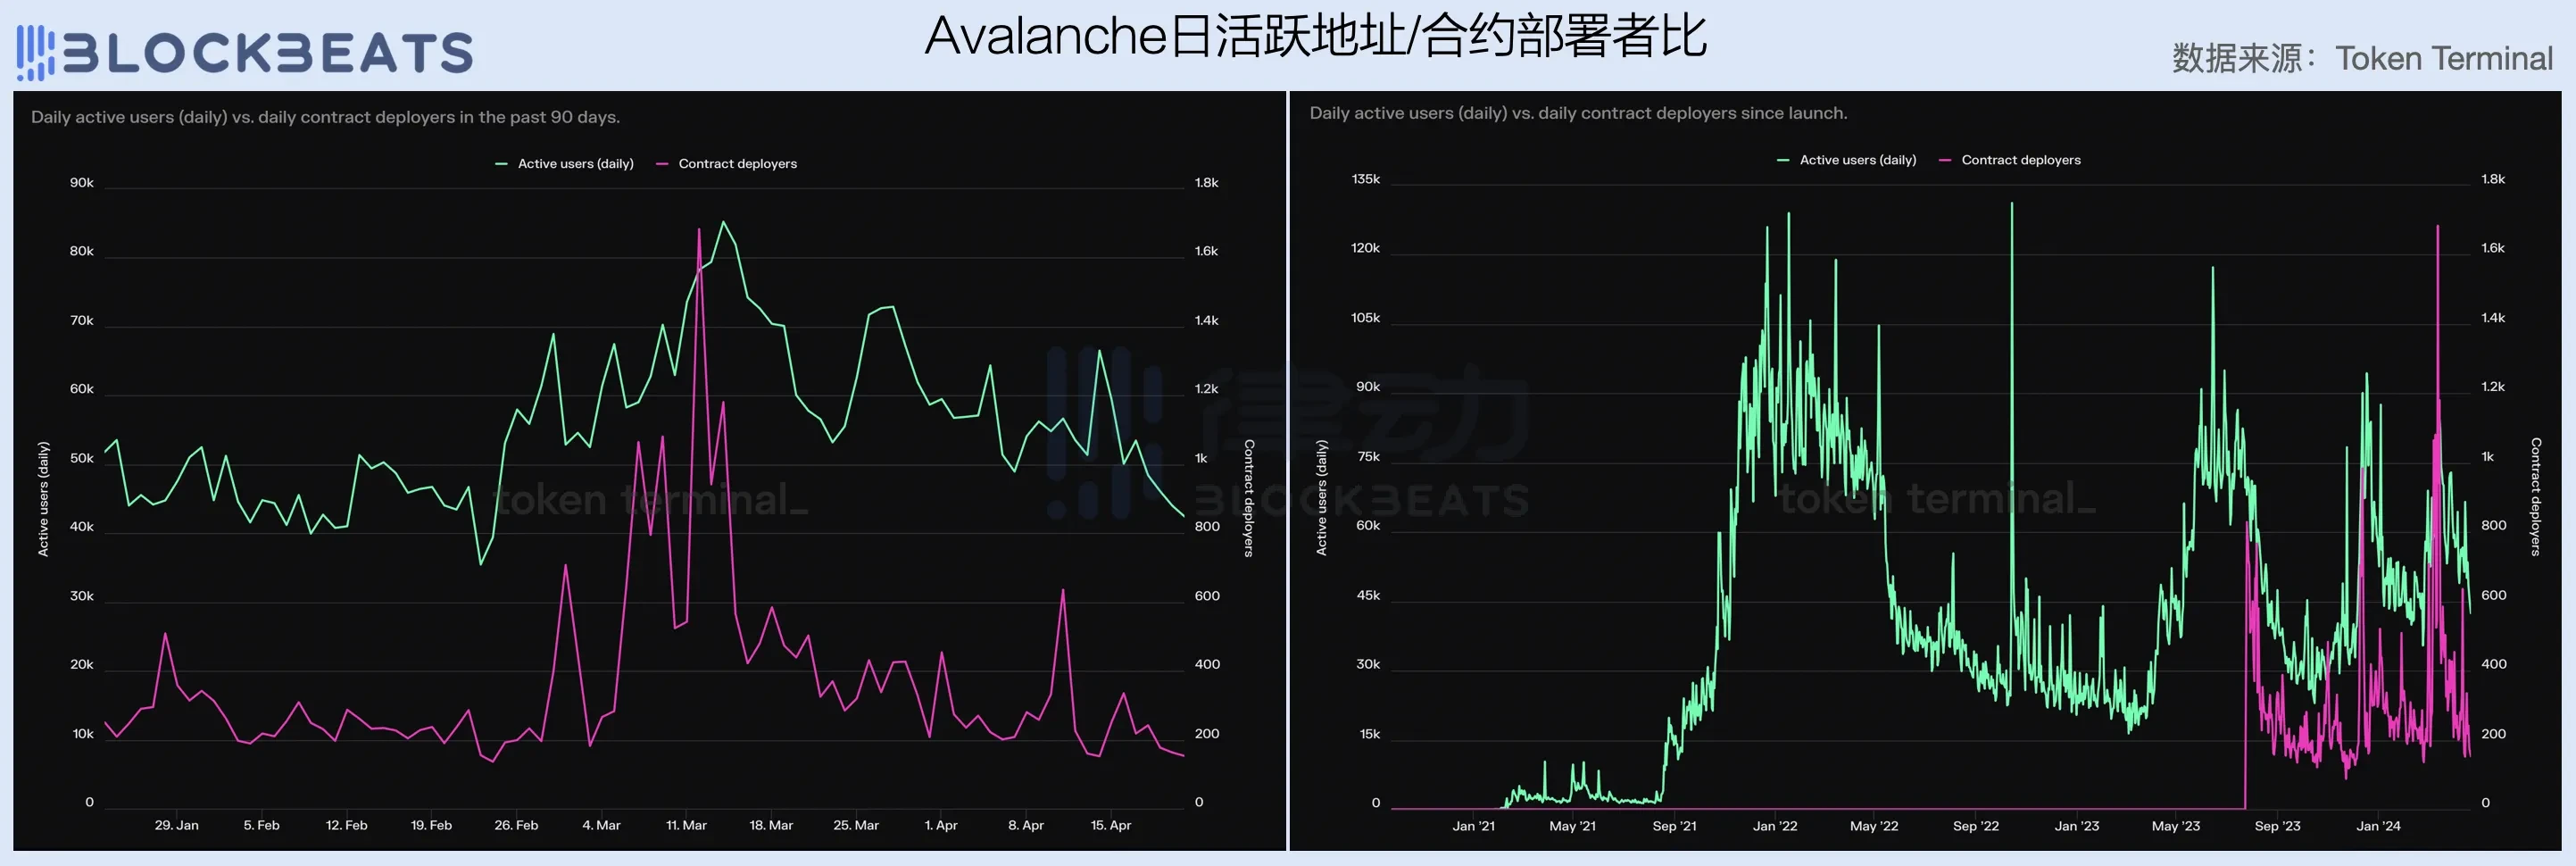
Compared with the first two, Avalanche is in the most severe situation, with almost no revenue in the first quarter, and it also pays relatively high operating costs. This is also largely related to the lack of appeal of Avalanches ecological applications in the past period of time. Since the end of last year, Avalanche has become a passive follower of industry hot spots. First, AVAV followed the trend of inscriptions, and then the foundation was slow to launch the meme foundation. Although the traffic has been caught, the effect is just so-so, and there is no achievement in overall revenue capacity.

Although Avalanche has used 100% of its transaction fees for repurchase and destruction, if we observe for a longer period of time, we will find that except for the brief period of profit achieved through AVAV during the EVM inscription fever, the Avalanche network has been burning money like Solana like crazy for the rest of the time.
Judging from the number of daily active addresses and contract deployers, the number of users and developers in the Avalanche ecosystem declined sharply in the first quarter. In the long run, it shows extremely high volatility, which means that the network user stickiness is low and is greatly affected by market conditions and hot spots.
In fact, Avalanches pessimistic data in the first quarter reflects to some extent the difficulties and challenges that the current EVM public chain and even the public chains that claim to have new languages and new narratives will face, that is, in the stock market with slow growth in the industry user base and oversupply of block space, it is difficult for products with basically similar user experience to stand out in the market and grab food from tigers like Ethereum and Solana. Like the wars in the Internet era, most of todays public chains have chosen to burn money, but the same problem remains: if there is no hope, how long will capital be willing to persist?
L2 is a profitable business
High initial operating costs and high uncertainty in revenue make it particularly difficult to start a public chain business, which is why the top 10 crypto market caps have changed so frequently and dramatically over the past 10 years. However, with the emergence of the modularization trend led by Celestia and the development of RaaS infrastructure such as Altlayer, the industry has gradually explored a more certain entrepreneurial opportunity than the public chain – L2.
The operating costs of an L2 include pre-development, running the sorter, and uploading packaged transactions (DA). Without considering the development costs, the fee income on an L2 can definitely cover the DA costs. Therefore, compared with the L1 public chain, L2 will hardly face the problem of not making ends meet. As long as the operating costs of the sorter are low enough, L2 is a profitable business. As the relevant infrastructure of one-click chain launch becomes more and more perfect, the cost of L2 entrepreneurship is also constantly decreasing, which is why L2 has appeared in large numbers recently.
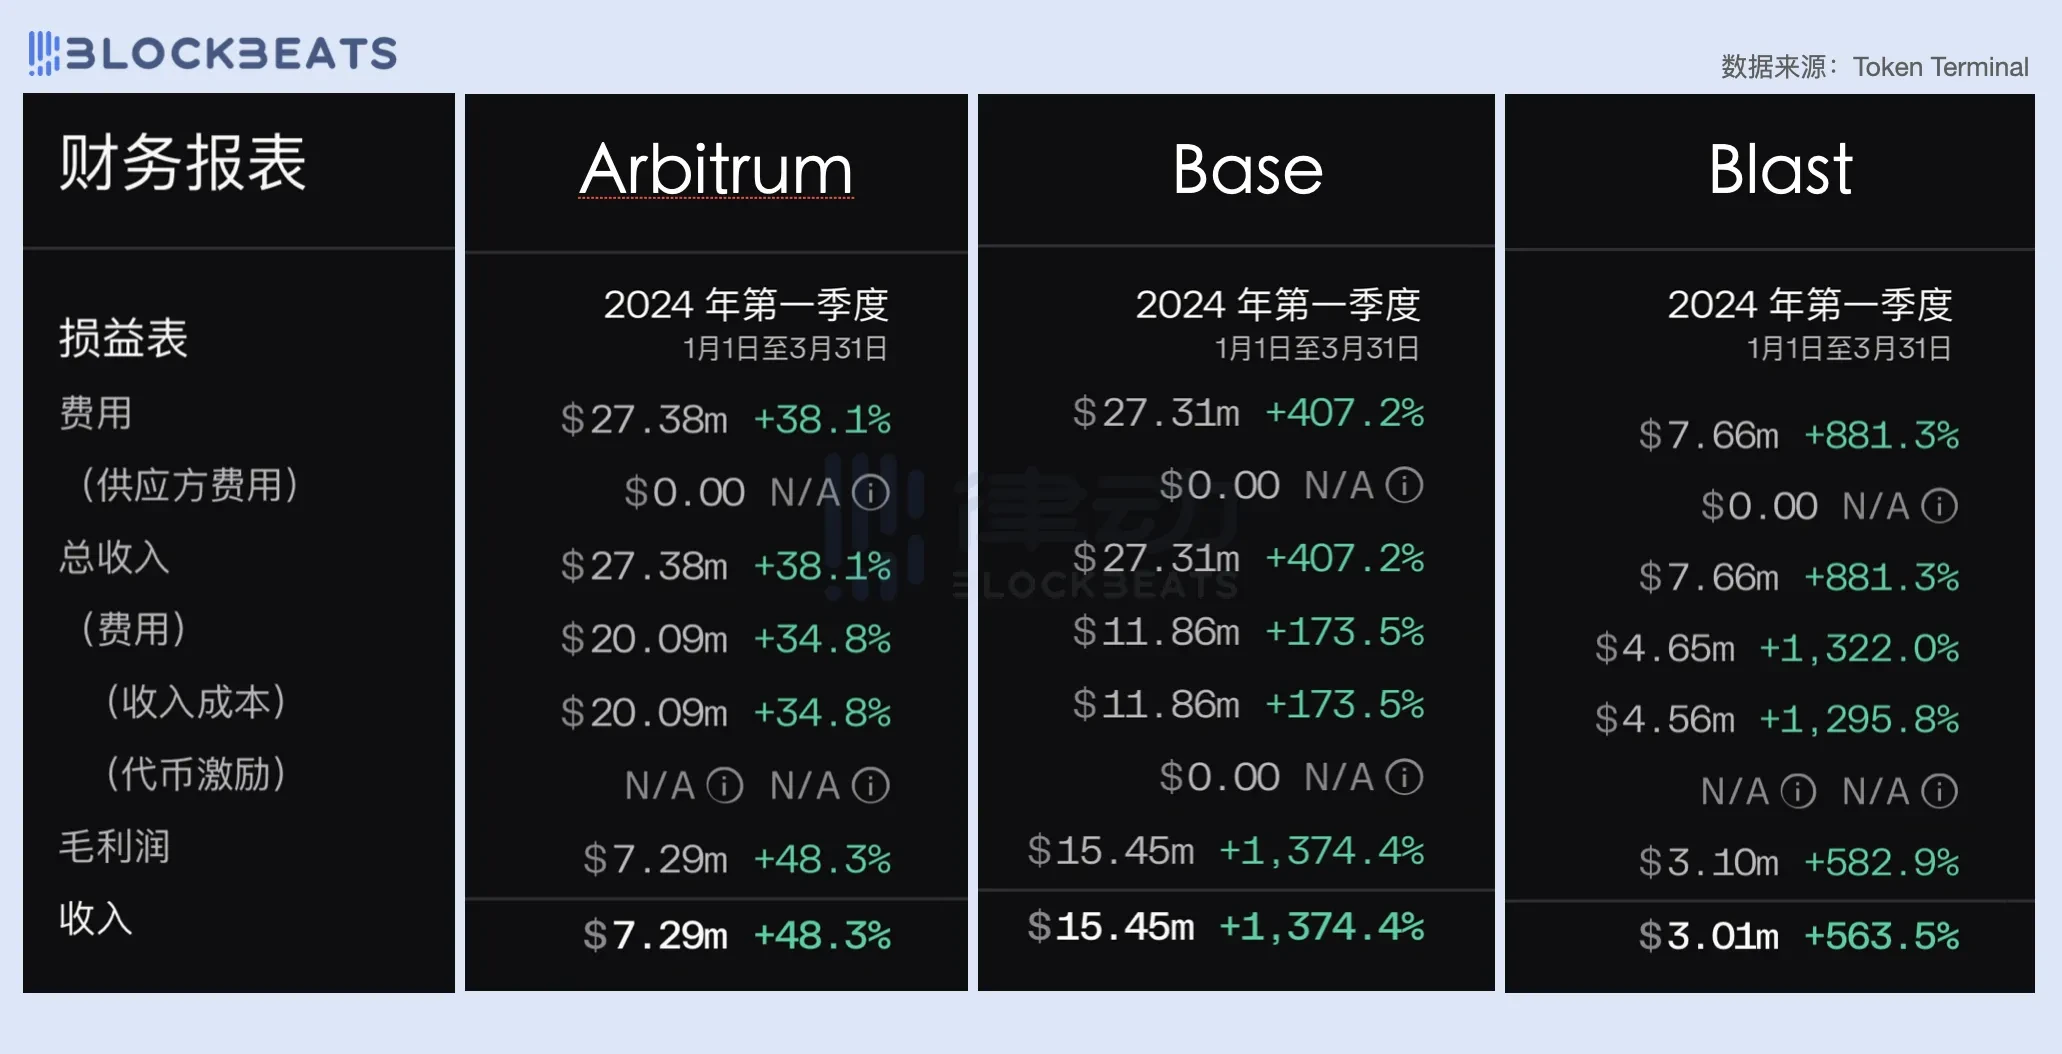
In this article, we compared the performance of three L2s: Arbitrum, Base, and Blast. You will find that L1 considers the break-even issue, while L2 seems to consider the issue of how much profit to make. In the first quarter, all three L2s were profitable, with Base and Arbitrum both having revenues of over $27 million. As a new L2 force, Blasts quarterly revenue of $7.66 million inevitably puts the L1s to shame.
Arbitrum has stable income
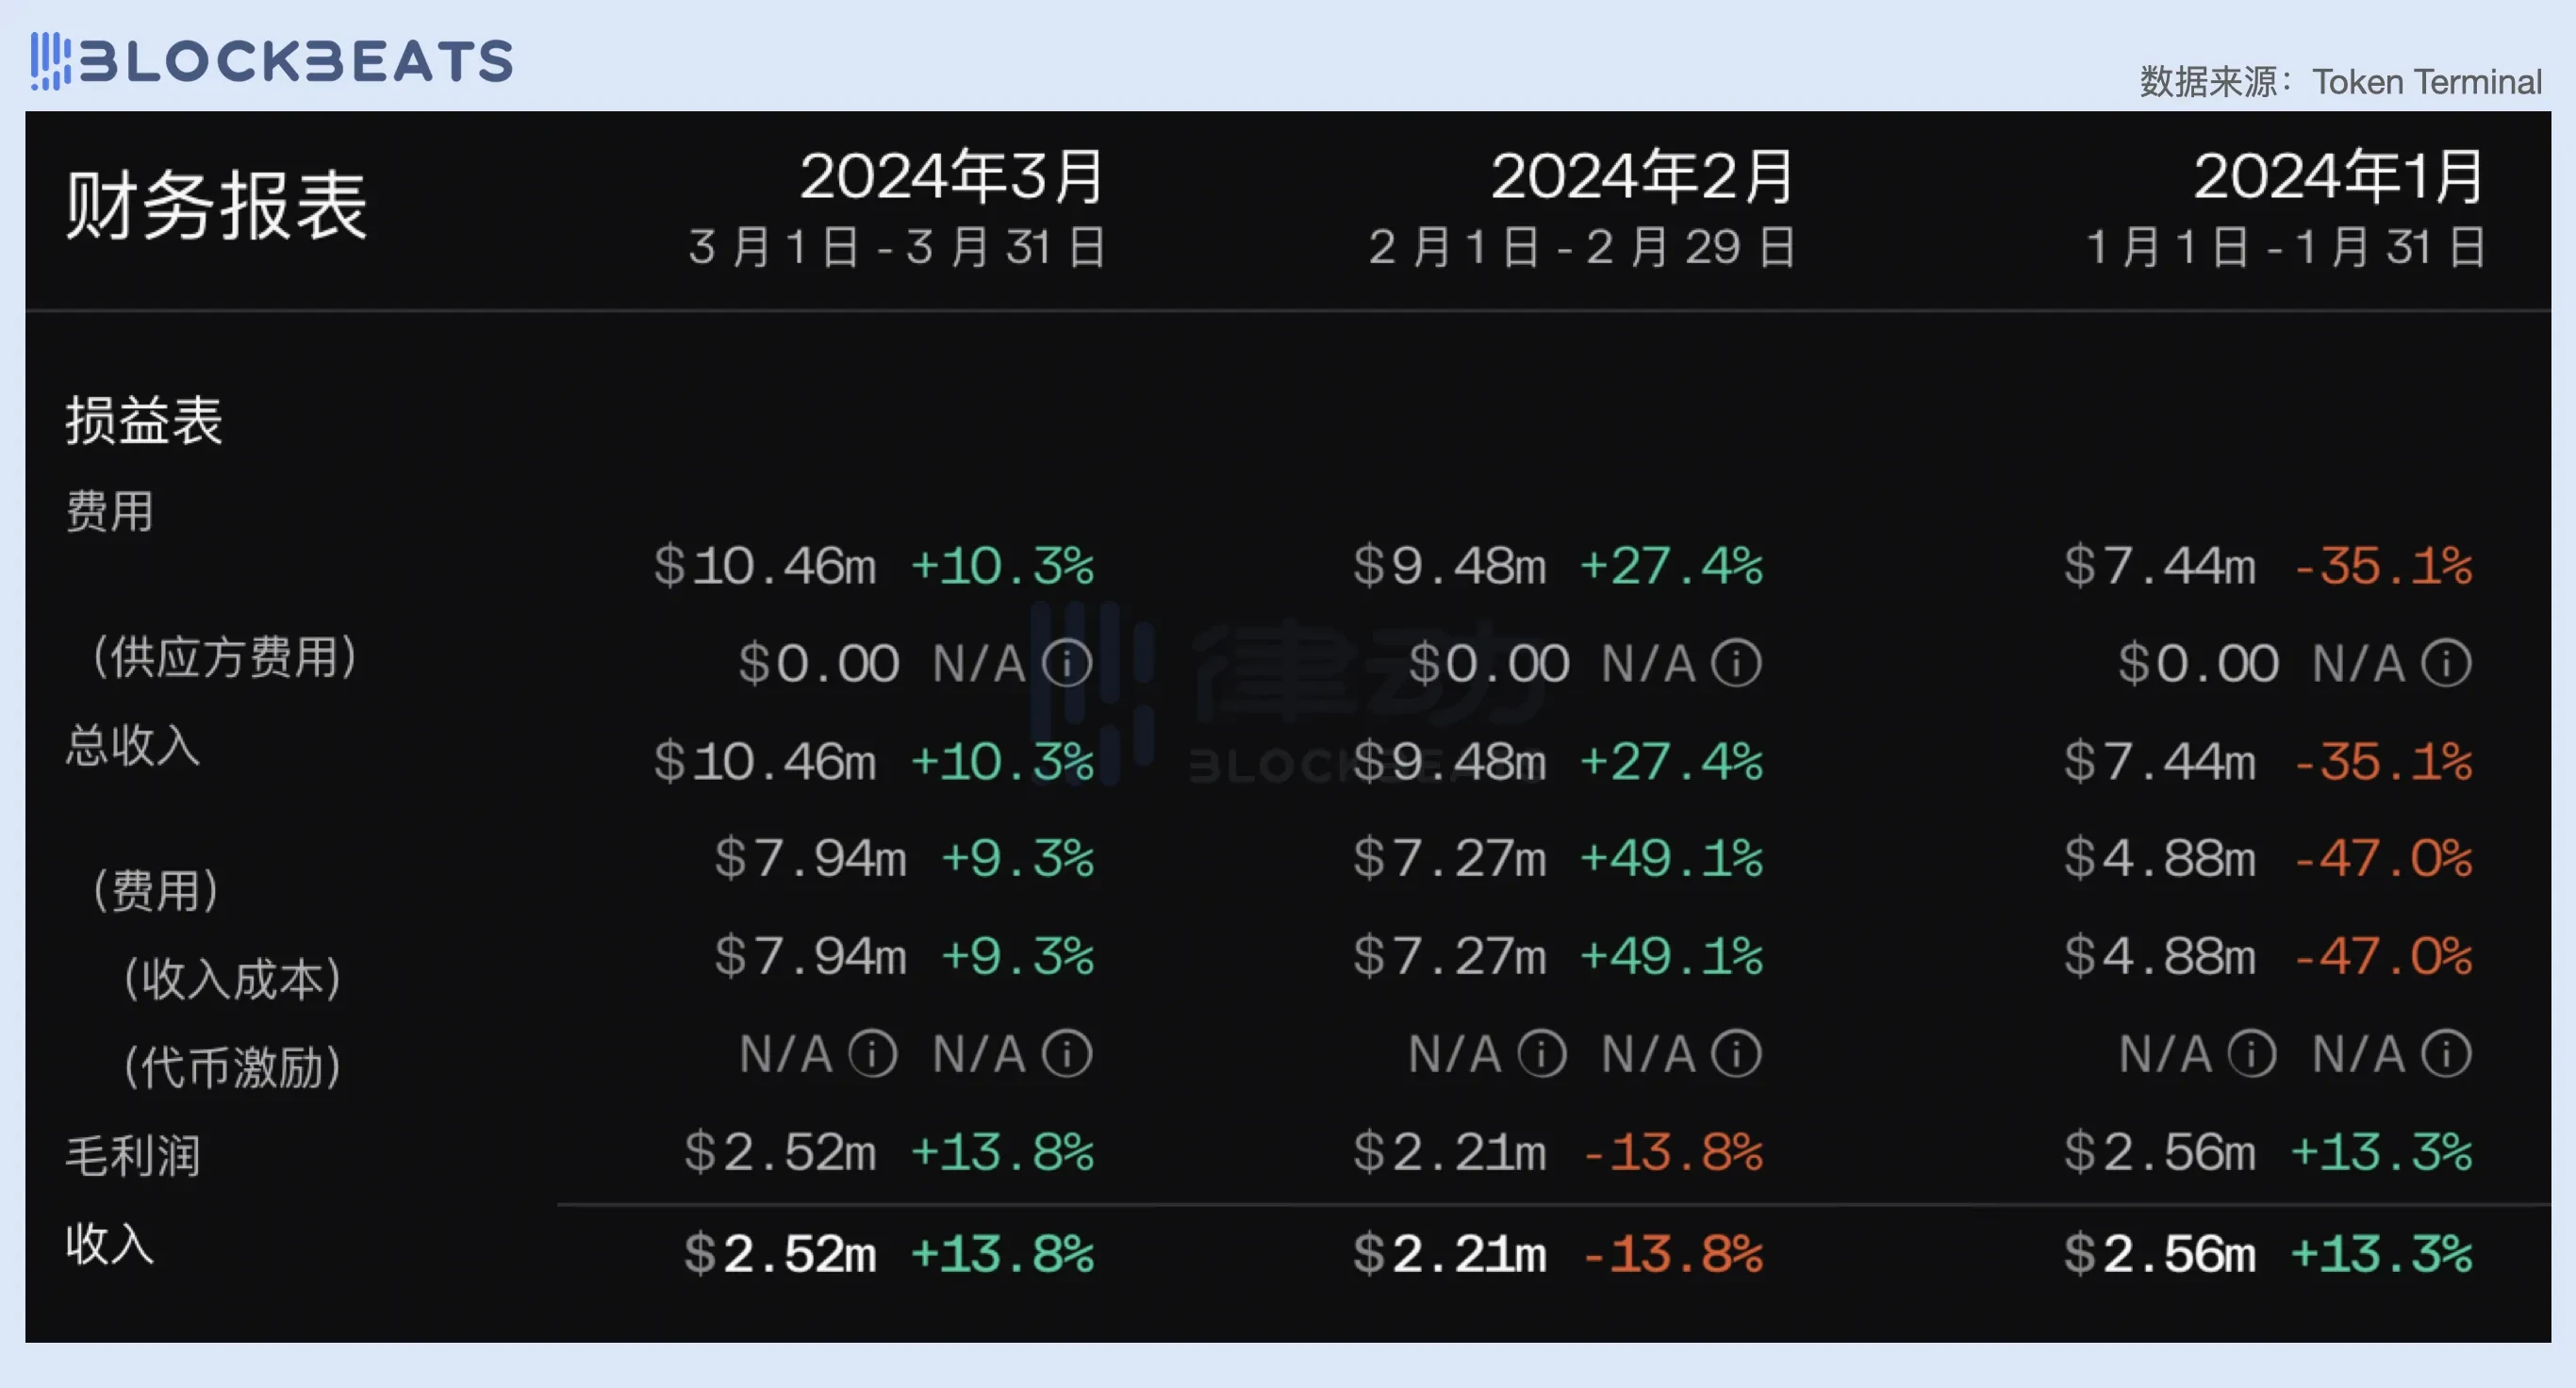
In detail, Arbitrums average monthly revenue in the first quarter was stable at around $2.3 million. In January, Arbitrums network revenue was $7.44 million, and after deducting DA costs of $4.88 million, the gross profit was about $2.5 million. In March, the revenue was $10.46 million, and after deducting DA costs of $7.94 million, the gross profit was also around $2.5 million.
It can be seen that before EIP-4844 and the Cancun upgrade, L2s revenue ceiling was fixed and very limited. Due to the positive linear relationship between fee income and on-chain costs, L2s gross profit margin has been limited to a fixed range. For Arbitrum, this figure remained between 25% and 40% in the first quarter. After the Cancun upgrade, the cost of L2 using Blob in DA was greatly reduced, which greatly improved L2s gross profit margin. As can be seen from the figure below, after EIP-4844 went online, L2s gross profit margin was basically stable at 90%. Of course, this data does not take into account the operating costs of the sorter.
However, the reduction in DA costs also reduces transaction fees. In the absence of incremental users, this means a sharp drop in network fee income. As can be seen from the figure below, although the operating costs are almost zero after the Cancun upgrade, the fee income of the Arbitrum network has also dropped significantly. According to the data in April, Arbitrums revenue has shrunk by nearly 80%, only about 2 million US dollars, but thanks to the extremely low DA costs, it finally achieved a gross profit of 1.88 million US dollars, which is only 25.3% lower than in March.

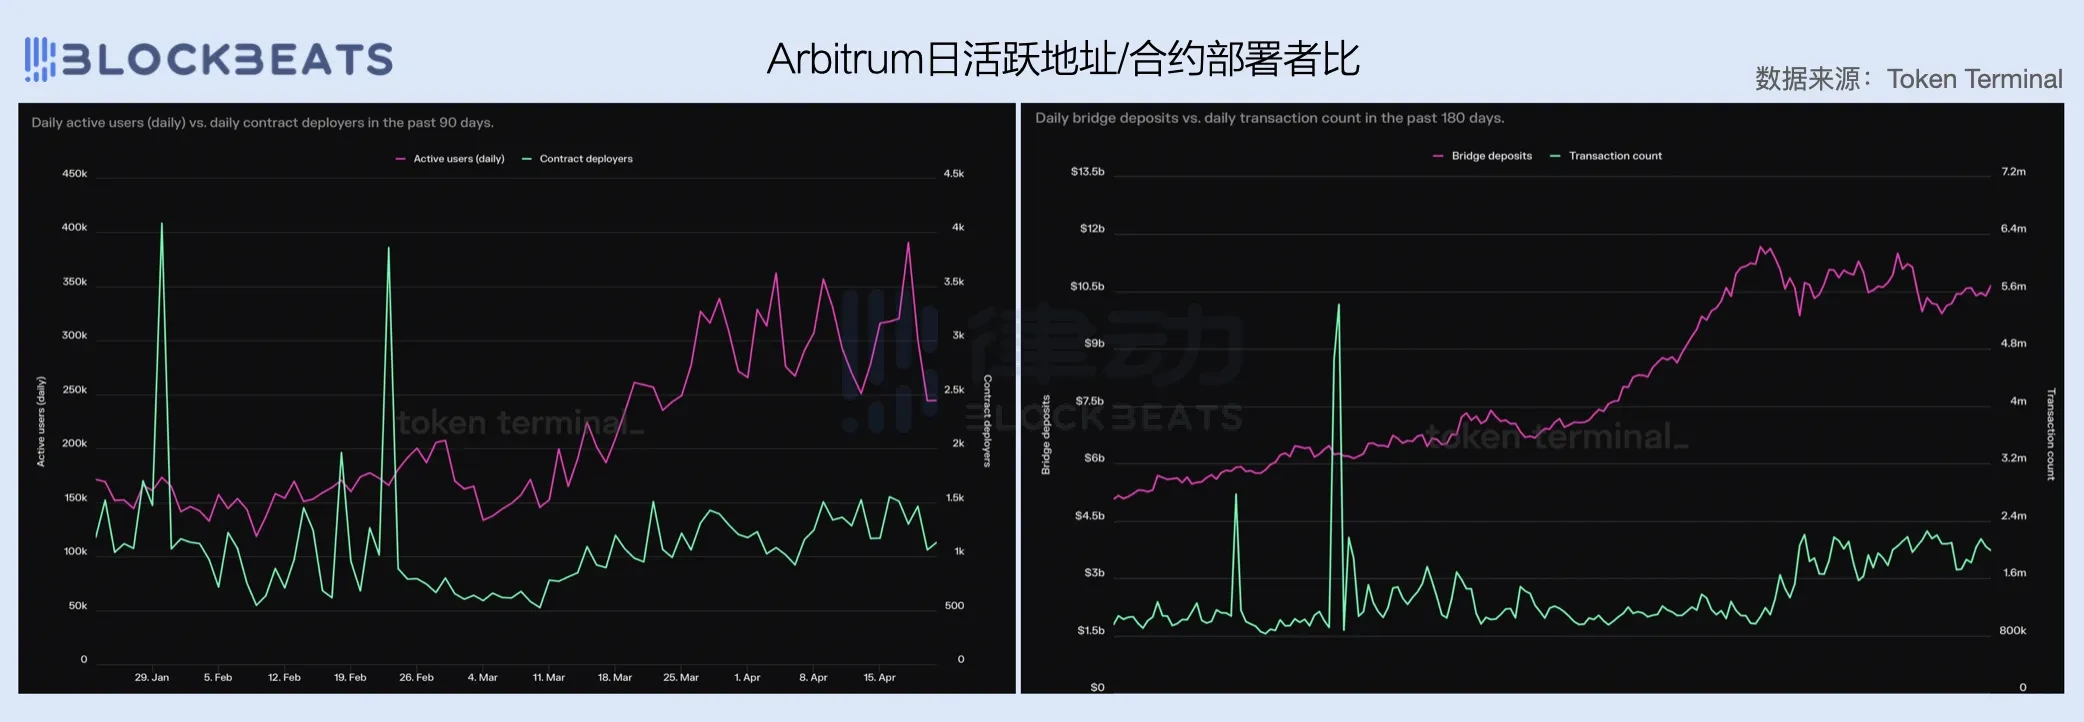
The gross profit margin has reached the extreme, but the revenue cannot grow. The bottleneck of user growth is also the biggest challenge facing Arbitrum. The growth of Arbitrums daily active addresses slowed down after March, while the number of contract deployers did not change much in the first quarter. The number of cross-chain assets and transactions also stopped growing in March. From the users perspective, Arbitrums tool value seems to far exceed its application value. The application scenarios within the ecosystem are single. On the one hand, it is difficult to activate existing users, and on the other hand, it is difficult to retain new users. In the eyes of many people, it has become a transit chain.
Base Explodes
Growth bottlenecks do not seem to be a problem for Base. In March, Base experienced explosive growth, with revenue increasing more than 4 times year-on-year. On the one hand, DA costs dropped sharply, and on the other hand, the number of users increased sharply. Excluding the DA costs of $6.34 million, the gross profit of the Base network in a single month was twice that of Arbitrum in the entire first quarter.

After the Cancun upgrade, Base also experienced a halving of revenue, but it quickly reversed the downward trend. Judging from the net profit data, the profit of the Bas network has been on the rise since the beginning of the year. After EIP-4844, Base has directly made a lot of money.
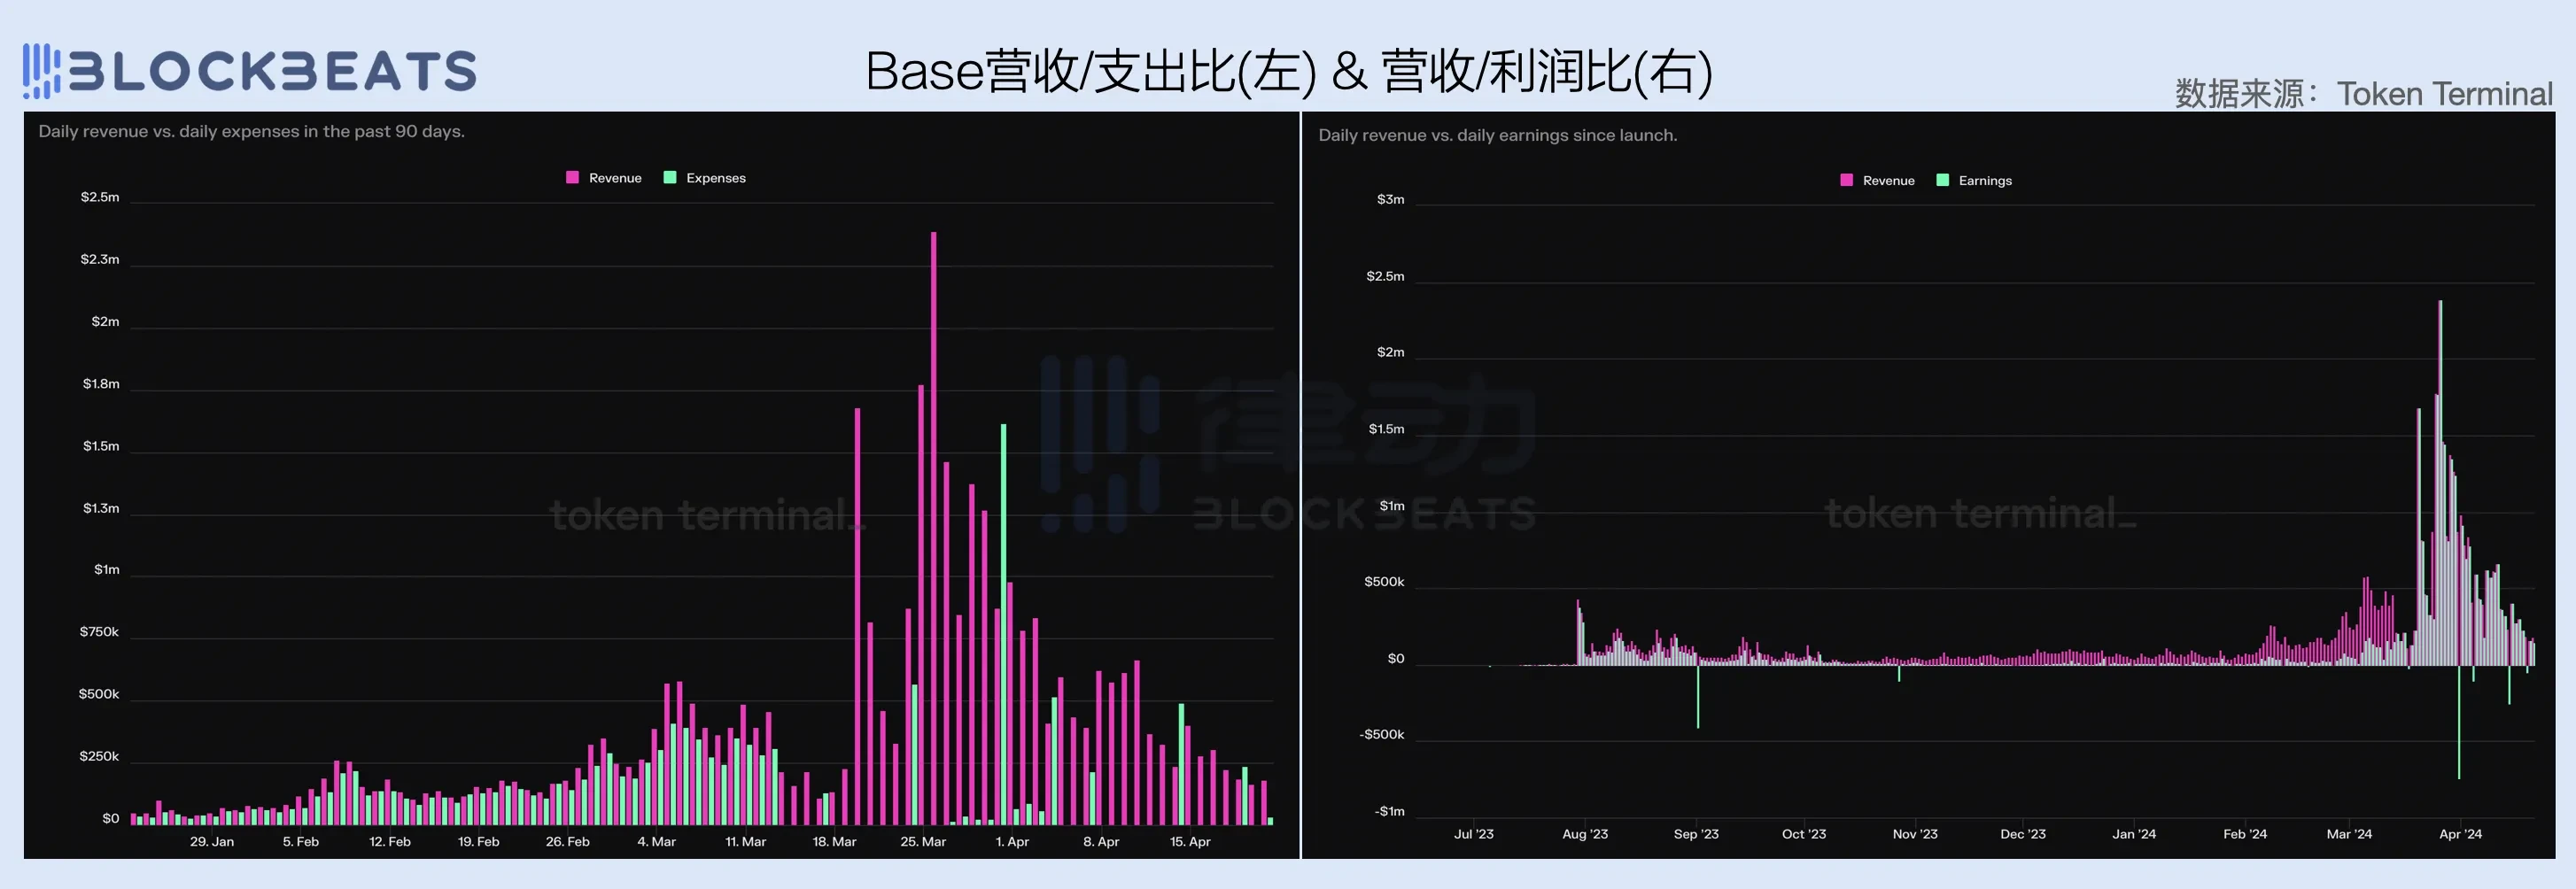
The explosive growth of revenue is inseparable from the narrative boost of the Base Season. In the past quarter, the Base network is one of the few networks with a high growth rate in the number of daily active addresses and contract deployers. However, it is worth noting that developers in its ecosystem still show strong market speculation. In April, when the overall liquidity shrank, with the continuous decline in the number of transactions and fee income, the number of contract deployers on the Base network also quickly halved.

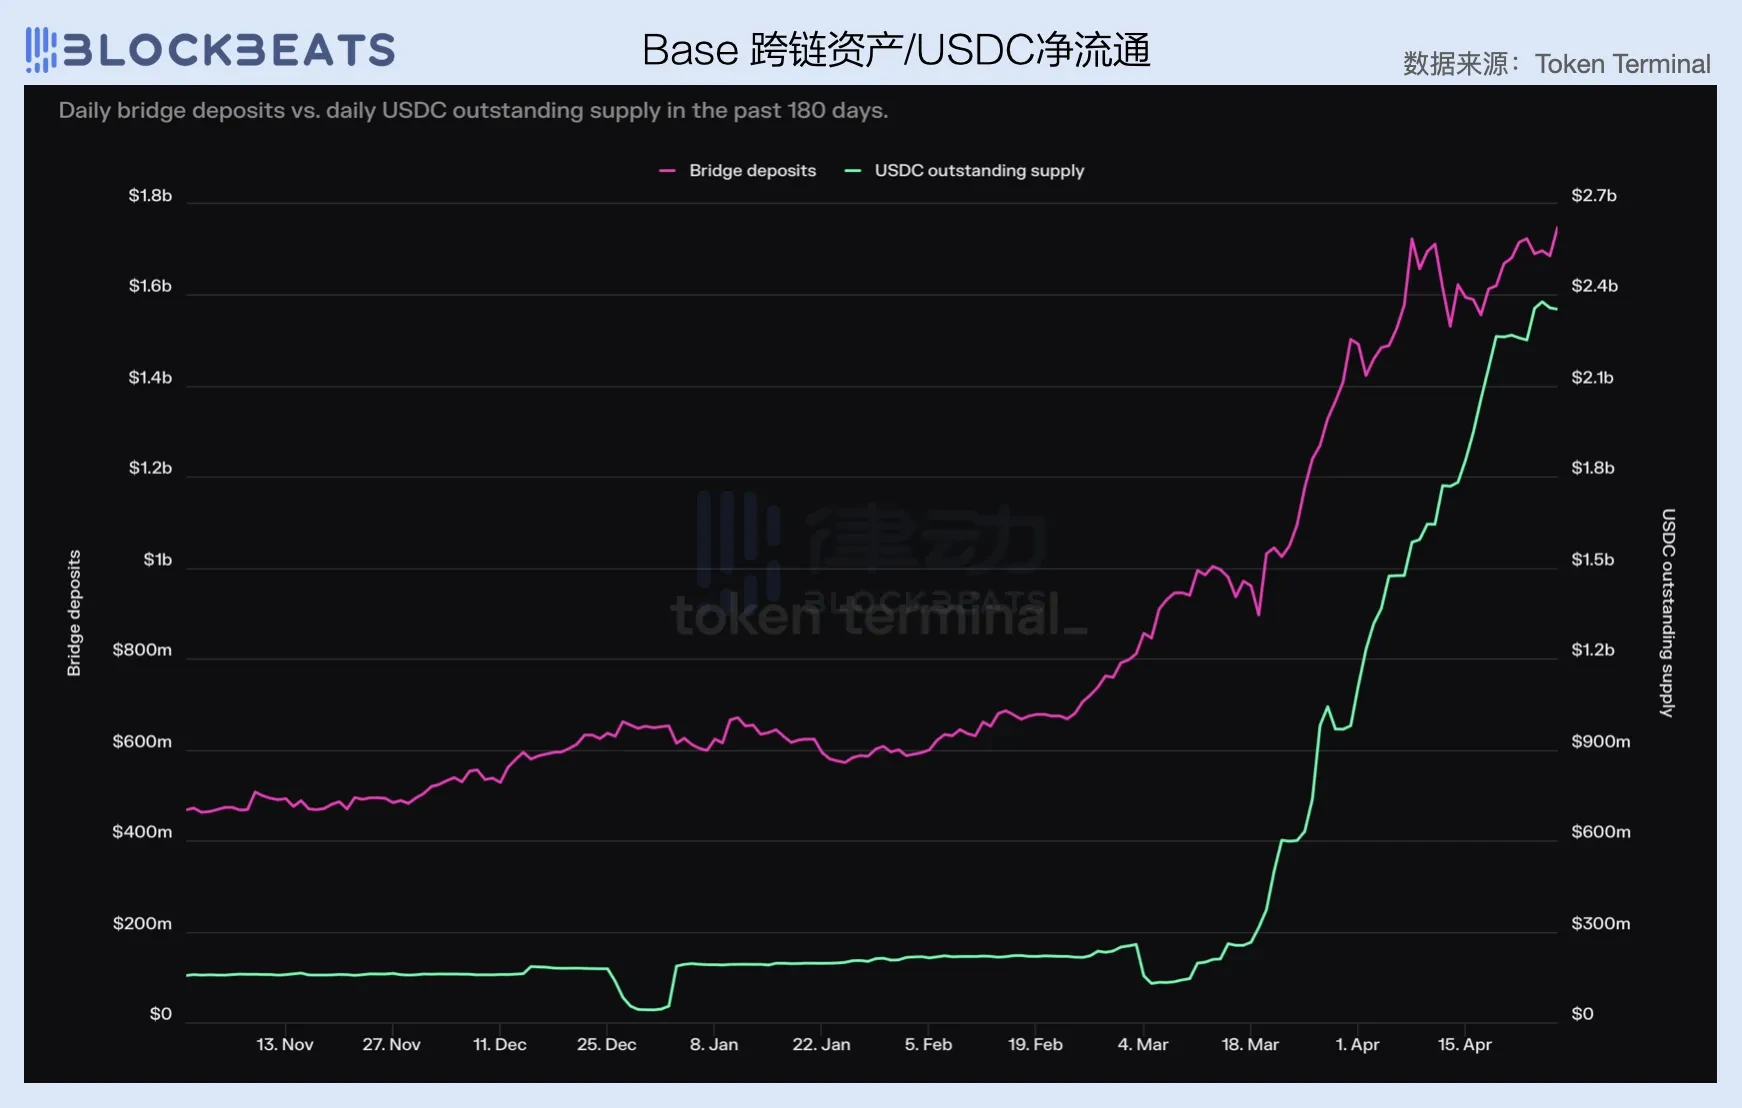
It is worth noting that although the overall popularity of the Base network has declined significantly in April, some fundamental signals about the Base Season are still being strengthened. Since March, the net circulation of USDC and the value of cross-chain assets on the Base network have begun to rise rapidly, and this momentum has not slowed down significantly even after entering April. With the improvement of market liquidity in the second half of the year, Base may become one of the most noteworthy ecosystems in the crypto industry.
Blast is lukewarm
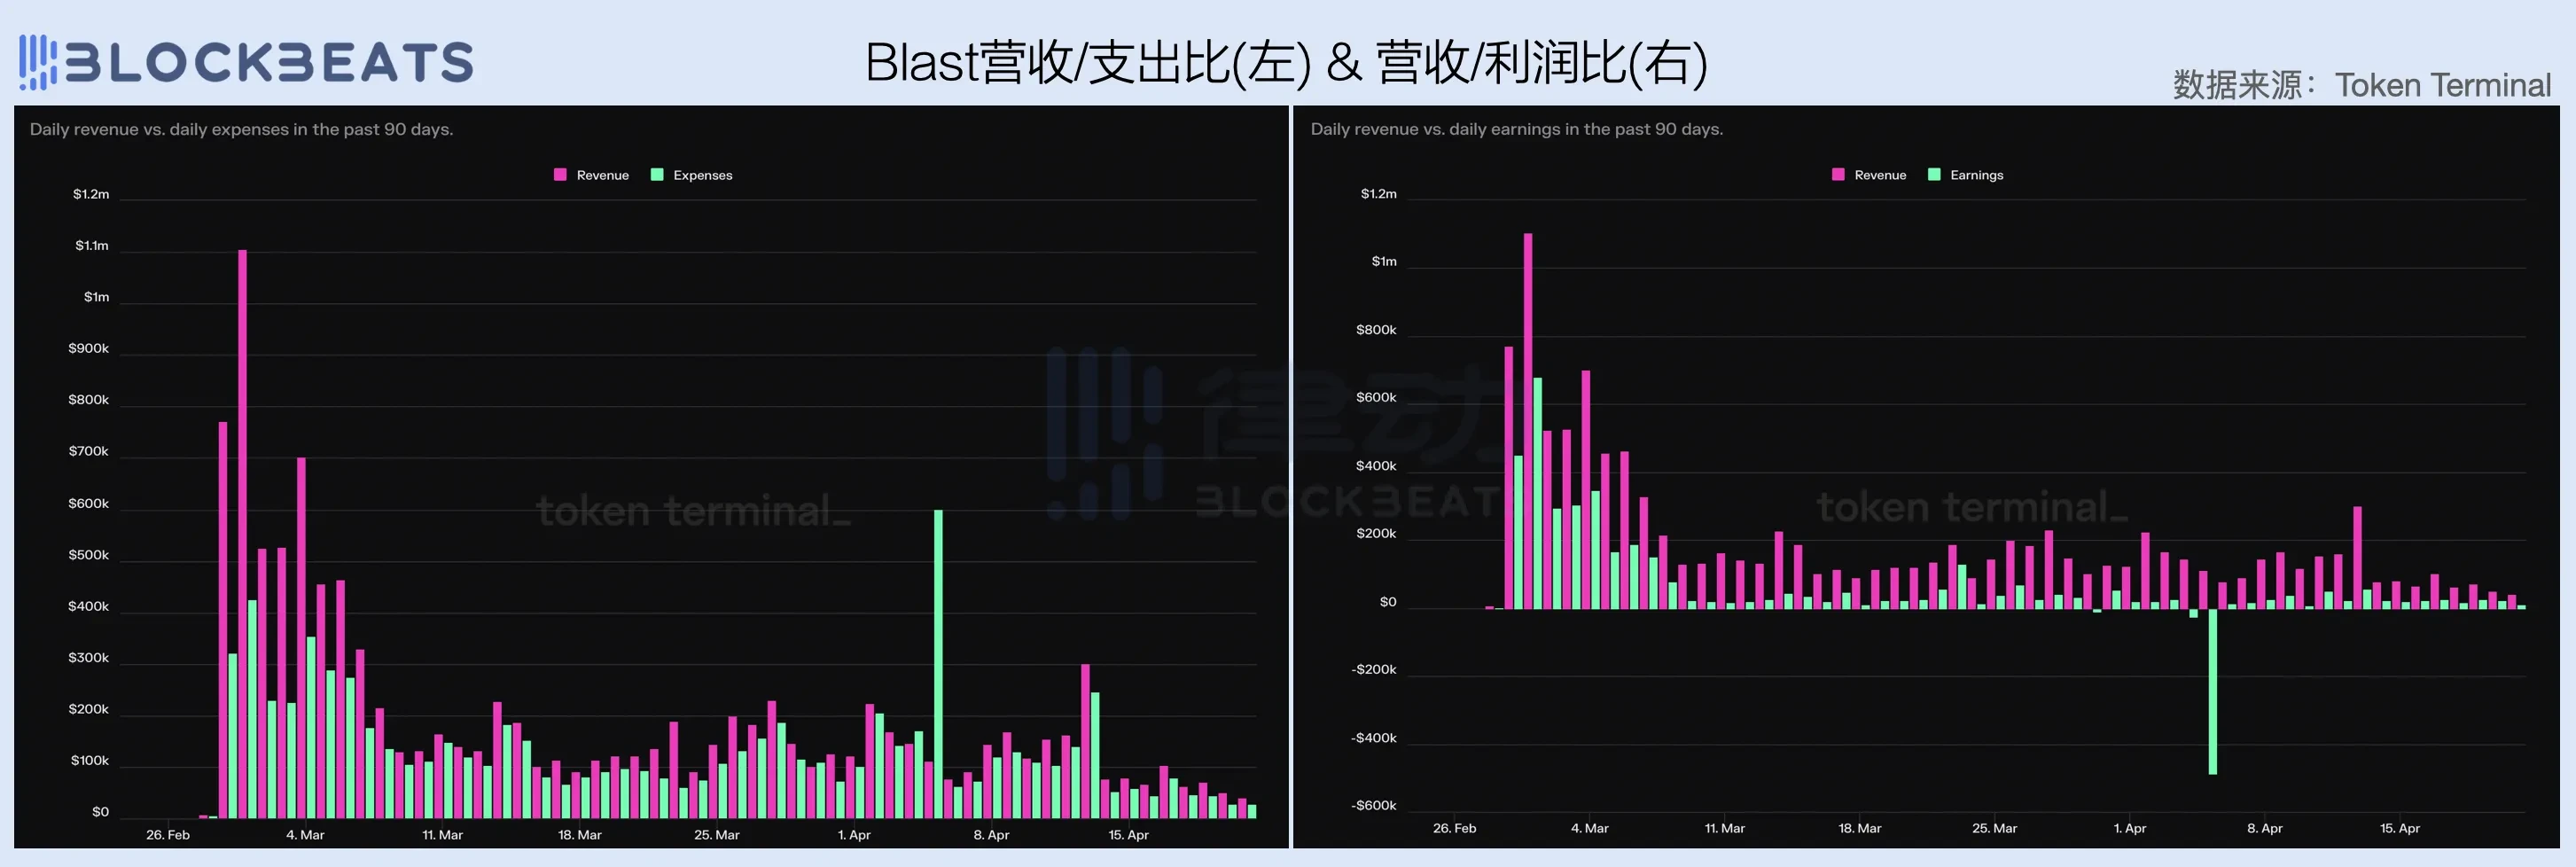
With the endorsement of Paradigm, traffic from Tieshun IP, support from KOLs, and participation from project parties, Blast, as a representative of the new L2 force, has been in the spotlight since its launch. However, judging from the financial data of the past two months, Blasts performance is not particularly ideal. After achieving a highlight in March along with the entire crypto market, Blast was beaten back to its original form in April, with revenue down more than 60% from March and gross profit of only $700,000.

An interesting point is that unlike other L2 networks, Blast鈥檚 operating costs did not drop significantly after the Cancun upgrade. Instead, they have remained at a high level, making it impossible for the network鈥檚 gross profit margin to break through.
However, compared with the gross profit margin issue, Blasts dilemma in terms of ecological growth is more worrying. The number of Blast contract deployers has dropped sharply in the past month, while the number of daily active addresses and daily transactions have stagnated after the decline in cross-chain capital inflows. Of course, it is a bit biased to use the April data generated against the background of overall market weakness to evaluate Blast, but to be honest, Blasts performance in March was not much better.

Similar to Avalanche, Blasts predicament also reminds the general-purpose L2 that is about to be launched, that is, in the current stock market has been divided by the leading L2, it is difficult for the new general-purpose L2 to achieve scale effect and get a share of the market. Perhaps in this stock competition environment, differentiation and vertical fields, and small and beautiful markets are the way out.
This article is sourced from the internet: 2024 Q1 Public Chain Financial Report: How are the revenue performance of public chains?
Related: Ethereum Tokens Are Pouring Into Exchanges Amid Regulatory Uncertainty
In Brief Ethereum witnessed a surge in on-chain activity as holders reacted to regulatory uncertainties, leading to its highest exchange inflow in years. Amidst the regulatory concerns and significant exchange inflows, Ethereum’s price experienced a notable decline of 10% over the past week. However, market observers explained that Ethereum’s fundamentals remain strong and the top asset might witness a market rebound soon. On-chain activity indicates a notable reaction to regulatory uncertainties surrounding the second-largest digital asset by market capitalization, Ethereum. A significant spike was registered in the number of tokens sent to centralized crypto exchanges. This is the biggest ever recorded since September 2022, profoundly influencing the price of Ethereum. Ethereum Sees Largest Exchange Inflow in 2 Years Ethereum has faced considerable scrutiny recently. Critics within the cryptocurrency community cite…


