
After reaching the golden ratio support, Shiba Inu (SHIB) experienced a bullish bounce. How far the price might rise from here depends on factors such as market sentiment, investor behavior, and overall cryptocurrency market conditions.
While the bounce is positive, it’s essential to consider potential resistance levels and monitor market dynamics to assess whether Shiba Inu is back in an uptrend.
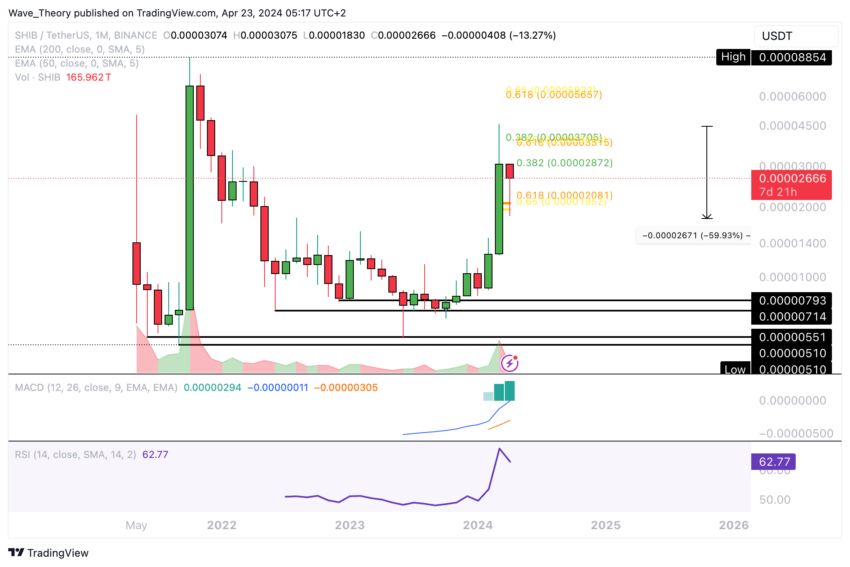
Shiba Inu Correction: Price Reaches $0.00002 Golden Ratio
Additionally, the neutral stance of the Relative Strength Index (RSI) indicates a balanced market sentiment, providing room for potential bullish continuation.
However, monitoring the price action closely for confirmation of sustained bullish momentum and to watch for any potential resistance levels ahead is essential.
SHIB Soars: Price Jumps Over 54% Recently
The 54% rise following the bounce off the Golden Ratio support is significant and indicates strong buying pressure in the Shiba Inu market. Despite the downward trend in the MACD histogram on the weekly chart, the fact that the MACD lines remain bullishly crossed suggests that there may still be underlying bullish momentum.
Read More: How To Buy Shiba Inu (SHIB) and Everything You Need To Know
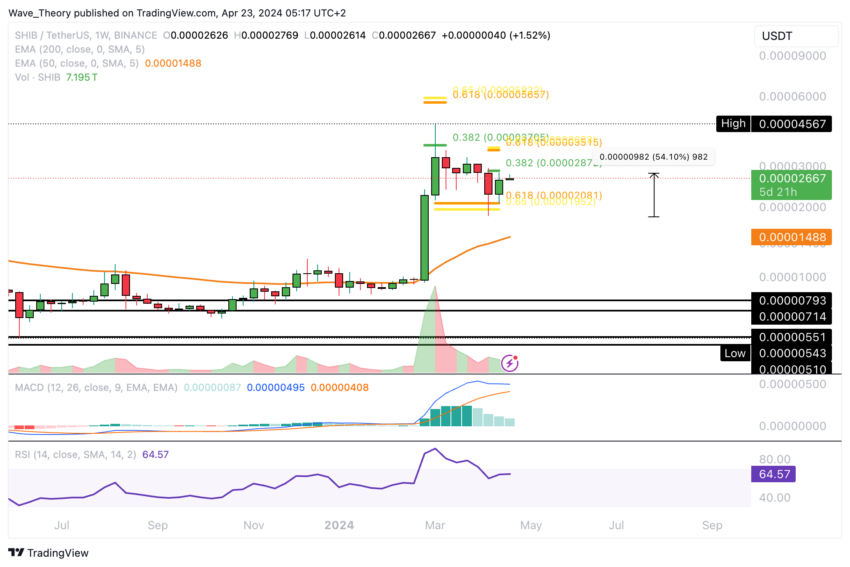
The neutral stance of the RSI further supports the idea that there is no extreme buying or selling pressure at the moment. It will be crucial to monitor how the price action develops in the coming days to assess whether the bullish momentum will continue or if there might be potential resistance ahead.
Where Will the Price Hit Next Major Resistance?
The current SHIB price faces notable Fibonacci resistance levels at $0.0000288 and approximately $0.0000355. Shiba Inu has surpassed the 50-day Exponential Moving Average (EMA) resistance, which is around $0.0000248.
Furthermore, observations from the daily chart indicate a bullish trend, with the MACD histogram displaying an upward trajectory and the MACD lines exhibiting bullish crossovers. Meanwhile, the RSI maintains a neutral stance.
The EMAs also signal a golden crossover, affirming a bullish trend in the short to medium term. However, it’s noteworthy that Shiba Inu remains within a parallel downward channel.
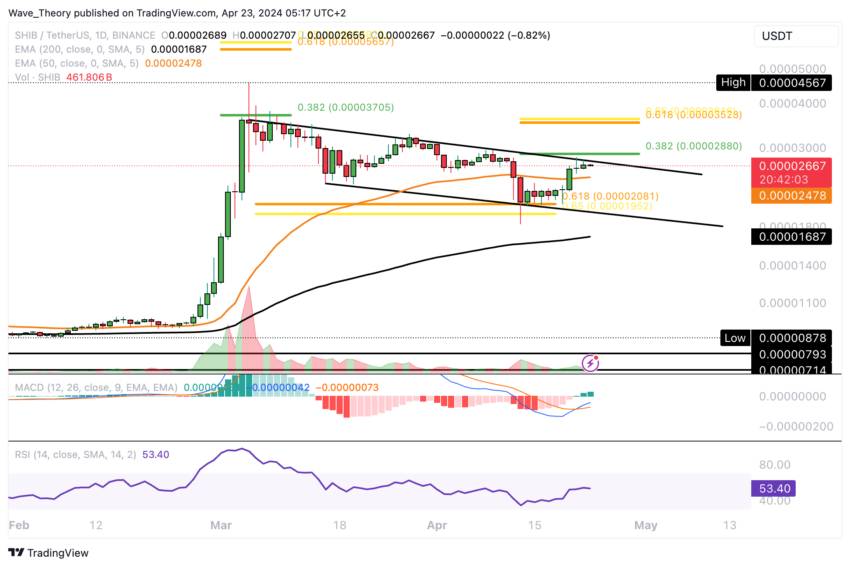
Shiba Inu must breach the .382 Fibonacci resistance level at approximately $0.0000288 for a breakout from this descending pattern. Additionally, Shiba Inu must surpass the golden ratio barrier around $0.0000355 to nullify the corrective phase.
There’s a Death Cross in SHIB’s 4H Chart: What Could Happen Next?
On the 4-hour chart, a Death Cross has emerged within the EMAs. However, given their close proximity, a potential Golden Crossover might ensue shortly, indicating a shift towards bullish sentiment in the short term. The SHIB price remains approximately 2.14% below the 0.382 Fibonacci resistance level, around $0.0000288.
Contrarily, the MACD signal is bearish on the 4-hour chart. The MACD histogram depicts a downward trend, accompanied by the bearish crossover of the MACD lines, while the RSI maintains a neutral stance.
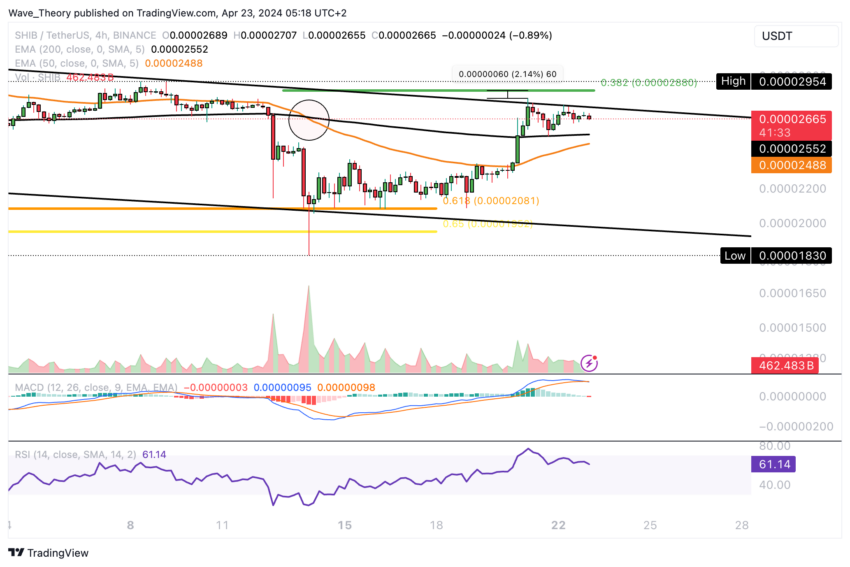
SHIB appears to be forming a lower high, suggesting a forthcoming short-term downturn without reaching the Fibonacci resistance. Following this corrective phase, Shiba Inu could re-attempt to breach the Fibonacci resistance level.
Read More: Shiba Inu (SHIB) Price Prediction 2024/2025/2030
SHIB Price Initiates Correction Against BTC
Against Bitcoin, Shiba Inu encountered support at the Golden Ratio level and subsequently ascended to the 0.382 Fibonacci resistance. Presently, the price is met with bearish rejection at this level.
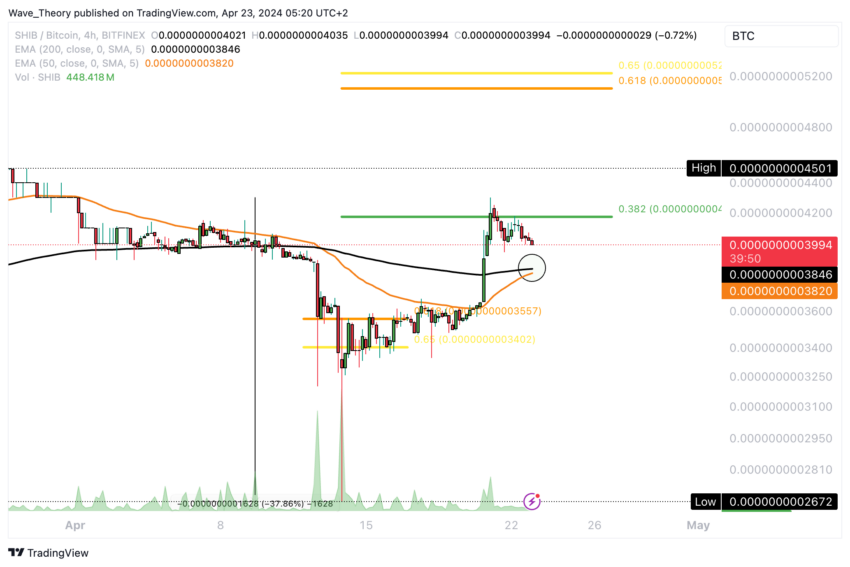
However, there is a notable development with the EMAs poised for a potential golden crossover. Should this occur, it would validate a bullish trend in the short term.


