
After reaching support around $0.43, the XRP price has rebounded bullishly. As for whether Ripple will continue its upward movement largely depends on factors such as market sentiment, broader cryptocurrency trends, and any fundamental developments specific to Ripple.
While the recent bounce from support is a positive sign, monitoring how XRP performs in the coming days and whether it can sustain its upward momentum is essential.
XRP Price Dips to $0.43 in Recent Correction
The recent correction in the Ripple price saw it reaching a low of around $0.43, where it found significant support and subsequently bounced back bullishly. Despite falling approximately 43% from its recent peak, Ripple has shown resilience by recovering strongly.
Ripple has climbed back above the 50-month EMA at the Golden Ratio around $0.52, which, if maintained by the month’s close, would signal a bullish trend continuation. However, it’s worth noting that the Moving Average Convergence/Divergence indicator (MACD) lines on the monthly chart remain bullishly crossed, and the Relative Strength Index (RSI) is still in neutral territory.
Conversely, the MACD histogram has begun to trend lower this month, indicating some bearish pressure.
Read More: Best Crypto To Buy Now: Top Coins To Keep an Eye on in April 2024
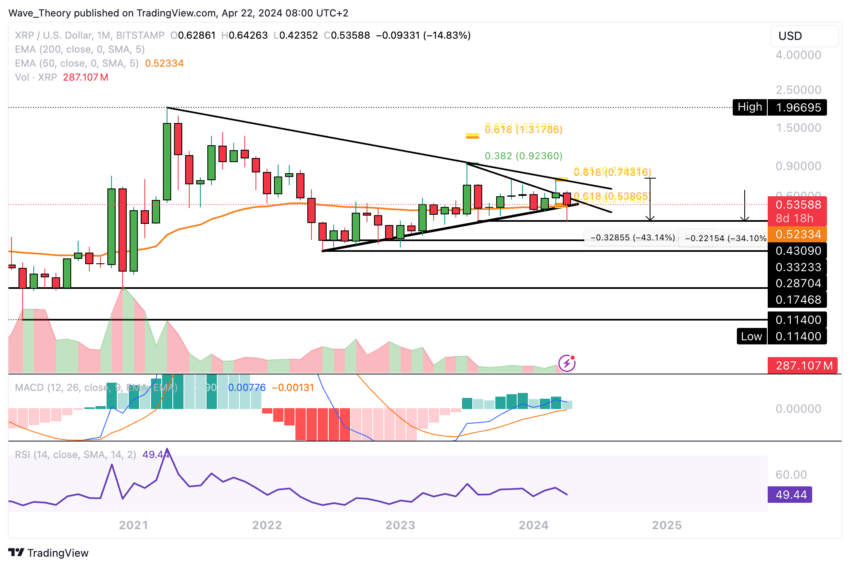
In summary, while the recent bounce from support is promising, Ripple’s price action in the near term will be crucial in determining whether it can sustain its upward momentum and resume its bullish trajectory.
Bearish Signals on Weekly MACD Chart
In the weekly chart for Ripple, we observe that the MACD lines have recently crossed bearishly, and the MACD histogram has been declining in a bearish manner for several weeks. Meanwhile, the RSI is currently situated in neutral territory.
Ripple is encountering notable Fibonacci resistance levels around $0.545 and $0.62. A breakthrough above the golden ratio resistance at $0.62 would signal Ripple’s end of the corrective phase, potentially reinstating an uptrend. Ripple could aim for further resistance around $0.75 in such a scenario.
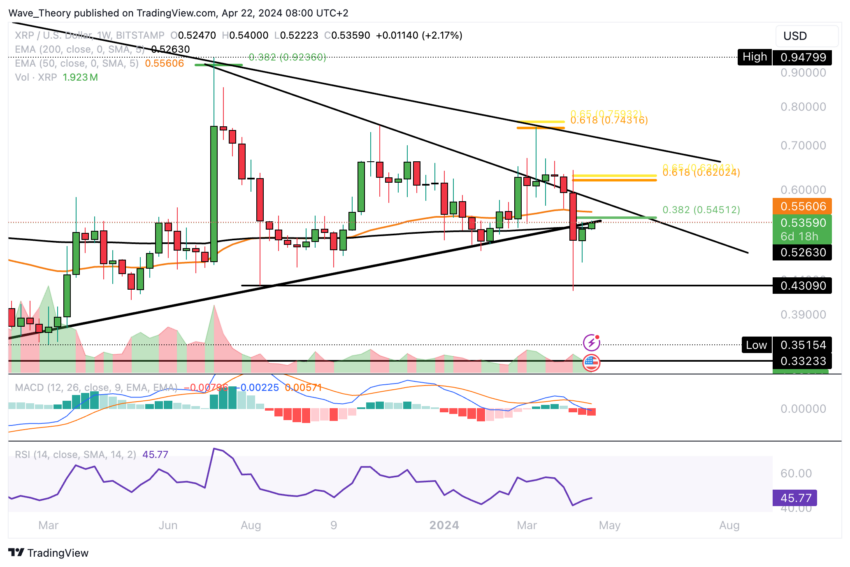
However, the corrective movement may persist until these resistance levels are convincingly breached. Traders and investors will likely monitor Ripple’s price action closely to assess whether it can overcome these hurdles and resume its upward trajectory.
Death Cross Emerging in Ripple’s Daily Chart Analysis
In Ripple’s daily chart, there’s a potential death cross formation in the EMAs, signaling a bearish trend in the short to medium term. However, if the current upward momentum continues, it could invalidate the death cross and potentially lead to a golden crossover instead.
Nevertheless, a bearish rejection at the current Fibonacci resistance around $0.545 could indicate further downside.
Looking at the MACD, the histogram has been trending higher for a few days, and the MACD lines are close to a bullish crossover, suggesting a possible shift toward bullish momentum. Meanwhile, the RSI remains neutral, lacking clear signals of bullish or bearish sentiment.

Traders may closely monitor price action around the resistance level for potential confirmation of further bullish or bearish movement in Ripple’s price.
Death Cross Confirmed in Ripple’s 4-Hour EMA Chart
In Ripple’s 4-hour chart, a death cross has indeed formed in the EMAs, indicating a bearish trend in the short term. However, it’s worth noting that the MACD is showing bullish developments.
The MACD lines are currently crossed in a bullish manner, and the MACD histogram is trending higher in a bullish manner as well.
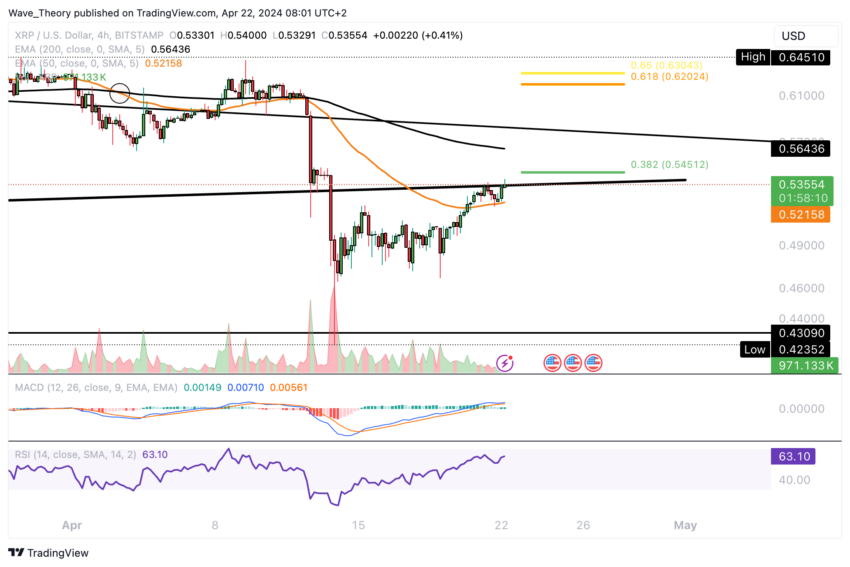
Despite these bullish indications in the MACD, the RSI remains neutral, lacking clear signals of either bullish or bearish sentiment. Traders may need to closely monitor price action for further confirmation of the prevailing trend in Ripple’s price.
Continued Decline for XRP Price Against Bitcoin Observed
Ripple’s price has indeed been experiencing a clear downward trend against Bitcoin. The key support zone for XRP against BTC is around 0.0000062 BTC.
Additionally, there are some positive signs in the technical indicators. The MACD histogram shows bullish momentum as it ticks higher, and there’s a possibility of a bullish crossover in the MACD lines. Moreover, the RSI is currently in oversold territory and indicates a bullish divergence, suggesting a potential reversal in the downward trend.
Read More: Ripple (XRP) Price Prediction 2024/2025/2030
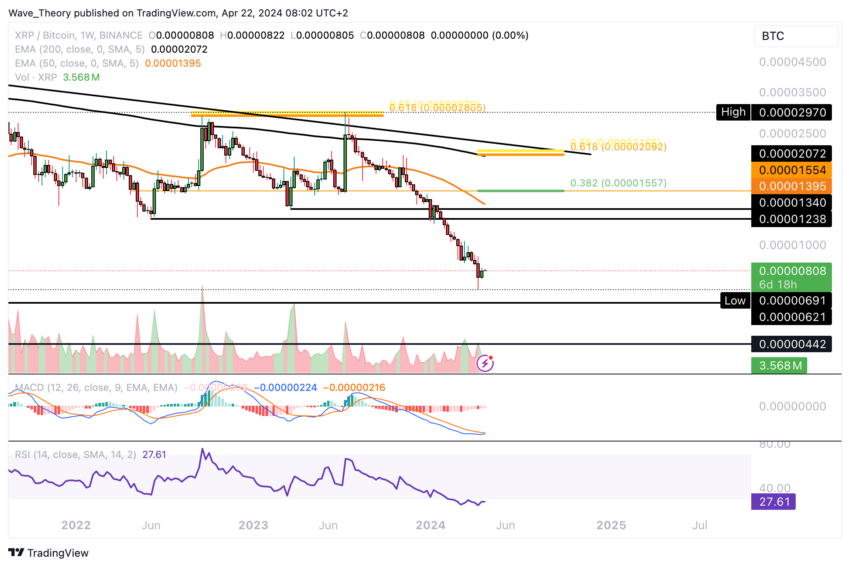
However, on the upside, Ripple faces significant resistance at the 50-week EMA around 0.00001395 BTC, with further resistance between approximately 0.00001238 BTC and 0.0000134 BTC. Traders should carefully monitor these levels for potential breakout or reversal opportunities.


