
Shiba Inu (SHIB) is currently undergoing a significant corrective phase. However, the price has now reached a crucial golden ratio support level, indicating the possibility of a bullish rebound.
Indeed, the price of Shiba Inu is surging, mirroring the trend seen in numerous other memecoins. This raises the question: Are we witnessing the rise of memecoins in this era?
Shiba Inu Hits Key Golden Ratio Support Level
Shiba Inu recently encountered substantial support at the golden ratio level of around $0.00002 following a notable correction. Before this, the memecoin faced rejection near the 0.382 Fibonacci resistance point at approximately $0.000037.
There’s a possibility of a bullish upturn from the Golden Ratio support, aiming toward the 50-day Exponential Moving Average (EMA), which poses a significant resistance barrier at roughly $0.00002464.
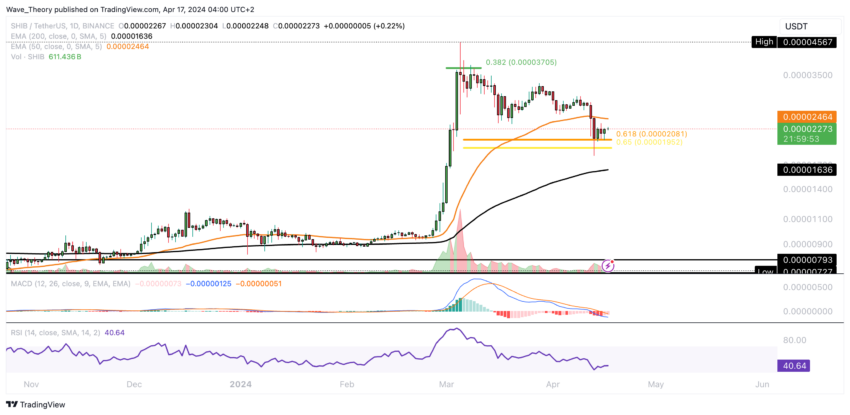
While indicators present a mixed picture, with the Relative Strength Index (RSI) in neutral territory, the EMAs exhibit a golden crossover, indicating a bullish trend in the short to medium term. Conversely, the Moving Average Convergence Divergence (MACD) lines have crossed bearishly. Yet, the MACD histogram has shown bullish momentum since yesterday.
Read More: How To Buy Shiba Inu (SHIB) and Everything You Need To Know
Death Cross Emerges in Shiba Inu’s 4H Chart
In Shiba Inu’s 4-hour chart, the Exponential Moving Averages (EMAs) have recently formed a death cross, indicating a short-term bearish trend. However, the MACD lines are currently bullishly crossed, and the MACD histogram shows bullish momentum.
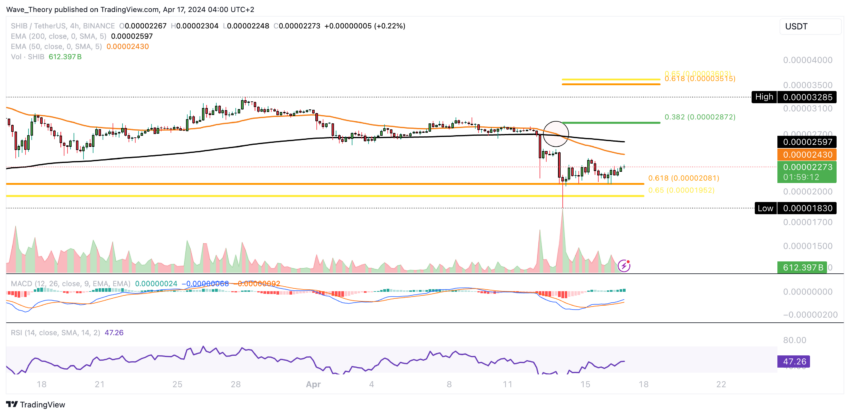
Despite these conflicting signals, the RSI is neutral, providing neither bullish nor bearish indications. Should SHIB experience a bullish rebound, it may encounter significant Fibonacci resistances around $0.0000287 and $0.000035.
Shiba Inu’s Weekly Chart: MACD Indicator Points to Bearish Movement
In the weekly chart, the MACD histogram has been steadily declining in a bearish manner for the past three weeks, indicating the potential for the MACD lines to follow suit with a bearish crossover. Despite this, the RSI is neutral, lacking clear bullish or bearish signals.

If Shiba Inu were to break below the Golden Ratio support at approximately $0.00002, it might find substantial support around the 50-week Exponential Moving Average (EMA), estimated at roughly $0.00001426.
Shiba Inu’s Steep Fall: Loses 60% of Its Value
Despite a correction of approximately 60% from its peak last month, SHIB continues to exhibit bullish indicators in the monthly chart.
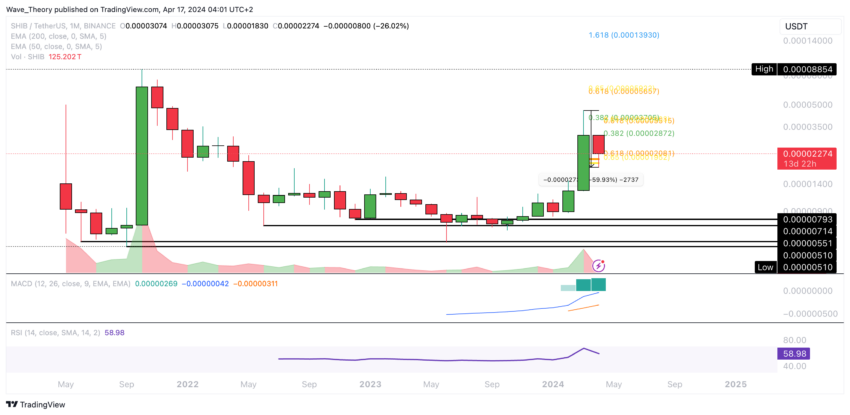
The histogram of the MACD still shows upward movement, while the MACD lines remain crossed in a bullish manner.
Read More: Shiba Inu (SHIB) Price Prediction 2024/2025/2030
SHIB Rose 230% Against BTC Last Month
Against Bitcoin (BTC), SHIB experienced a remarkable surge of approximately 230% last month. However, this month has seen a significant correction, with the price declining by over 37% thus far.

Shiba Inu is currently at significant golden ratio support against BTC, suggesting a potential bullish rebound in the near term.


