Chainlink’s (LINK) price is currently showing signs of attempting to break out of the downtrend it has been experiencing, signaling a potential recovery from recent losses.
Although investor behavior appears to support a breakout, Chainlink (LINK) may encounter resistance due to its existing bearish obligations.
Is It a Good Time to Invest in Chainlink Now?
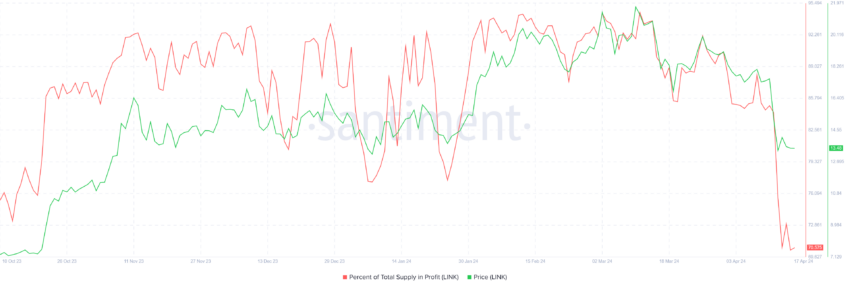
Chainlink’s price for the past few days is giving its all to ensure it does not fall below $13.5. There is a good possibility that it may find support from investors to keep this from happening. This is because the recent correction led to the LINK supply losing profitability.
The total supply in bearing gains is now close to 70.5%, meaning a bearish outcome is less likely. Generally, when more than 95% of the supply is in profit, a market top is formed, which precedes corrections.

Since that is not the case, LINK could witness some accumulation, which could increase its price.
Read More: How To Buy Chainlink (LINK) and Everything You Need To Know
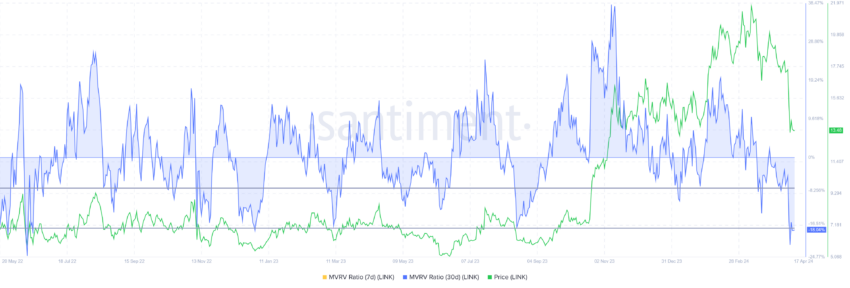
This is also backed by the Market Value to Realized Value (MVRV) Ratio. The MVRV ratio measures investor profit/loss. Chainlink’s 30-day MVRV at 17.9% signals losses, potentially prompting accumulation. Historically, LINK recovery occurs at -8% to -18% MVRV, terming it an opportunity zone for accumulation.

Thus, should the investors note the potential of profits in accruing LINK, accumulation could be the next move.
LINK Price Prediction: A Climb to $17 Next?
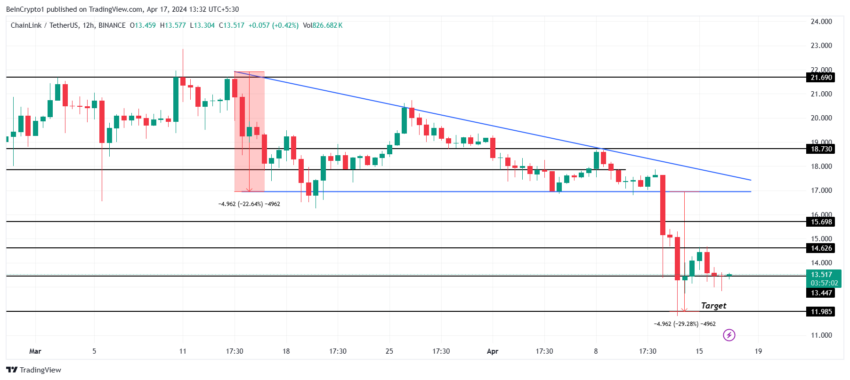
Chainlink’s price is hovering around the $13.4 support level, trading at $13.5. This level has been supporting the altcoin for several days now, and a bounce back from this point could be expected.
Supported by the factors mentioned above, LINK could witness a recovery once it breaches $14.6. This would enable Chainlink’s price to rally to $17, provided it does not concede to the resistance at $15.6 on the way up.

However, there is also a chance that the altcoin could fall through the support of $13.4 to hit $12. This is the target price marked by the descending triangle Chainlink’s price, which LINK was stuck in a few days ago.
Read More: Chainlink (LINK) Price Prediction 2024/2025/2030
Losing it would invalidate the bullish thesis and cause a further decline to $11, making a recovery significantly difficult.


